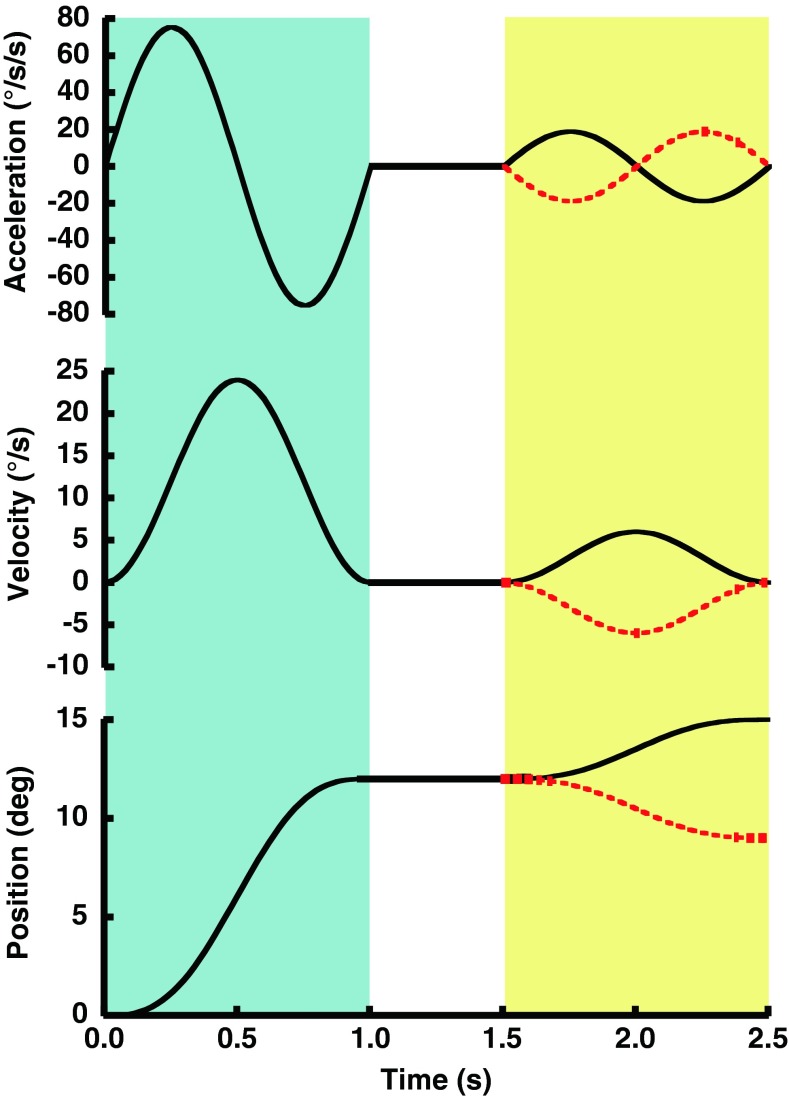
FIG. 1.
Diagram of the motion experienced by a subject during example trials with a 1 s adapting stimulus, 0.5 s ISI, and 1 s test stimulus. The examples shown would have occurred at the start of a trial block when the largest test stimuli (3 °) were used. In this example, the adapting stimulus was 12 ° of motion to the right and is the same for both trials. The same movement is shown in the acceleration (top panel), velocity (middle panel), and position (bottom panel) domains. The adapting stimulus occurred during the initial 1 s (blue shading), the ISI from 1 to 1.5 s (no shading), and the test stimulus from 1.5 to 2.5 s (yellow shading). The test stimulus could be in either direction: right (black) and left (red dashed).

