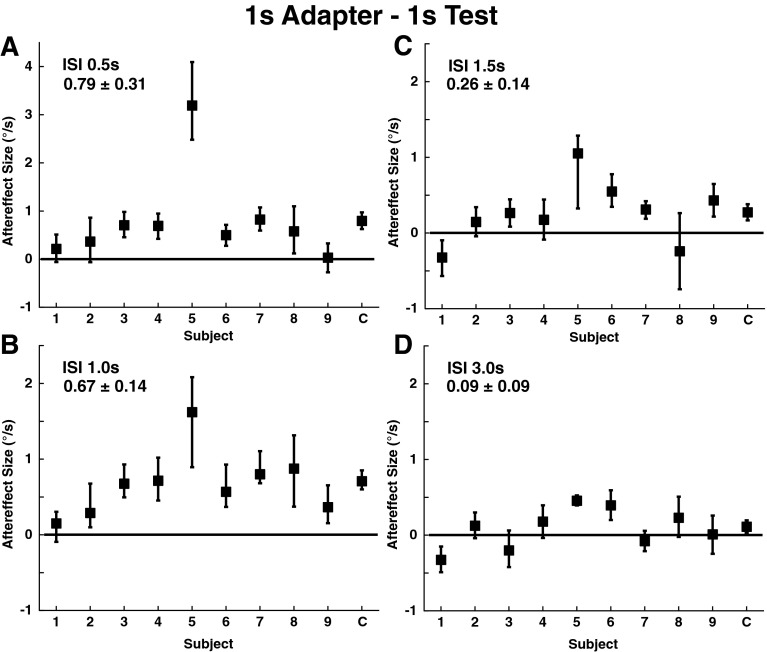
FIG. 4.
Size of aftereffect by subject using a 1 s adapter and 1 s test stimulus. Each data point represents the median aftereffect size calculated using a bootstrapping method with 2,000 fits to the data after resampling. Trials with NF and FP were combined as these conditions had no influence on the bias. The mean ± SE of the individual responses is shown in the upper left of each panel. The scale of the y-axis in (A) has been expanded relative to the others to allow an outlying data point to be shown. Error bars represent the 95 % confidence interval. Panel A: ISI 0.5 s, the mean aftereffect size was 0.79±0.31 °/s (mean±SE). Panel B: ISI 1.0 s, 0.67±0.14 °/s. Panel C: ISI 1.5 s, 0.26±0.14 °/s. Panel D: ISI 3.0 s, 0.09±0.09 °/s.

