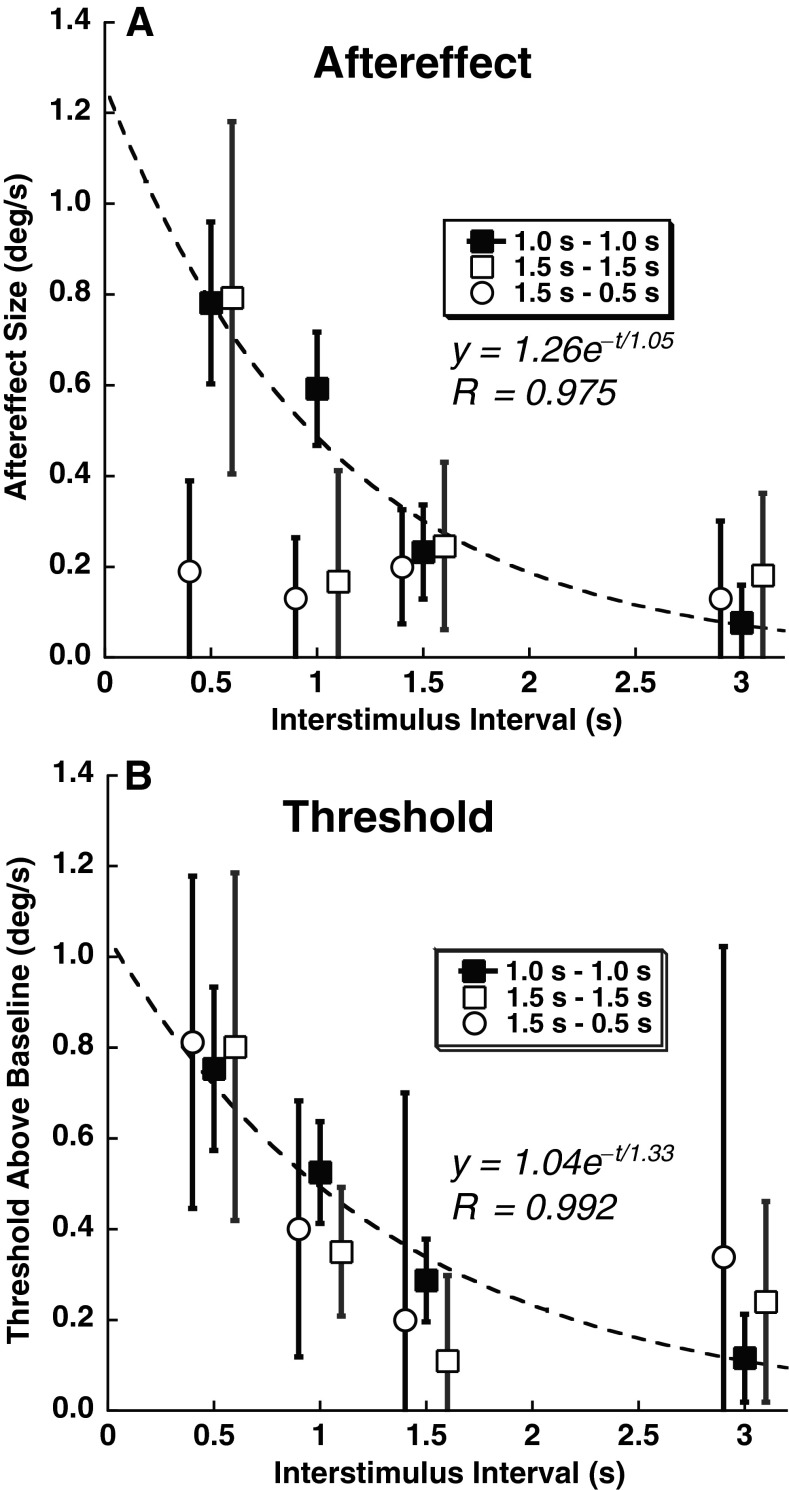
FIG. 7.
Decay of aftereffect and increased threshold with time. The data are averaged across subjects and the FP/NF viewing conditions for the 1 s adapter/test (filled squares). For the 1.5 s adapter/test condition (open squares), the data represent the subjects who completed that study at only the NF viewing condition. The open circles represent the six subjects who completed the 1.5 s adapter, 0.5 s test stimulus condition. Error bars represent ±1 SEM. For clarity, the ISI on the 1.5 s adapter conditions have been displaced slightly, and curve fits represent only the 1 s–1 s condition which had better quality fits. A The aftereffect size as a function of ISI. B Threshold above baseline as a function of ISI. The baseline threshold was determined by presenting the test stimulus without an adapting stimulus (0.62 °/s) and subtracted from the threshold here. Thus, zero indicates the baseline threshold.

