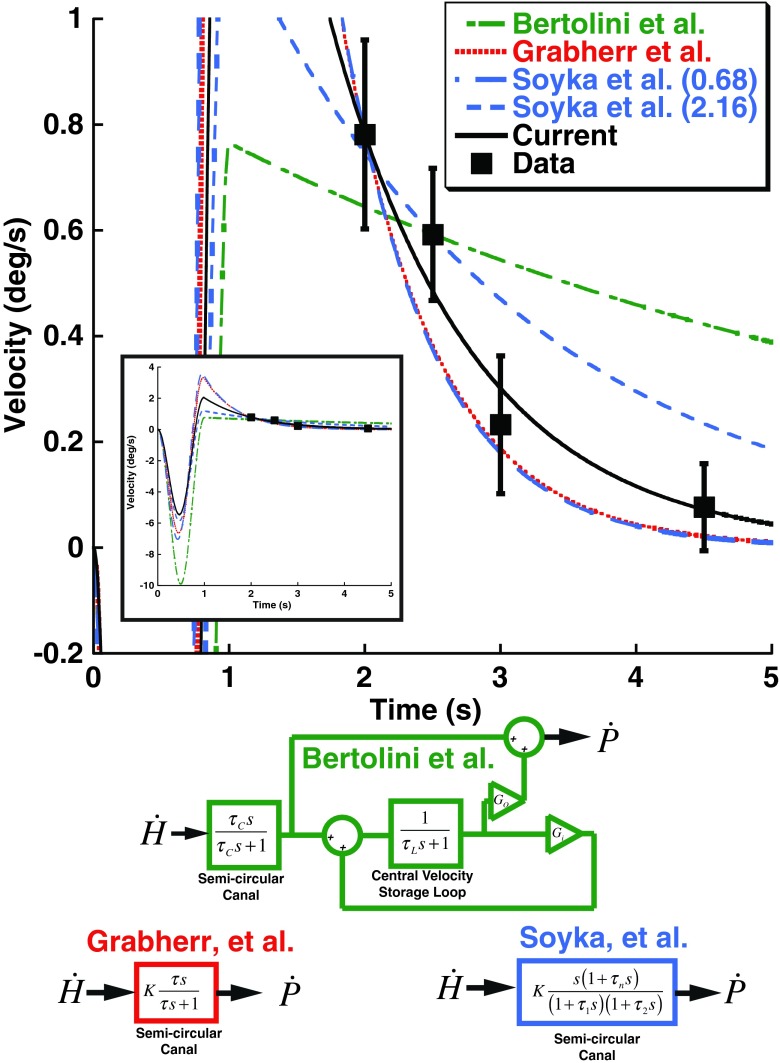
FIG. 8.
Predictions of previous models of yaw rotation perception. Data points shown in Figure 7 for the 1 s adapter/test stimuli are included (squares) with error bars representing ±1 SEM to demonstrate the observed aftereffect size. Note that these points are plotted at the time their respective test stimulus would have reached its peak velocity rather than the ISI itself. The inset shows the full range of the models. In all models, s is the Laplace variable. The green model represents that proposed by Bertolini et al. based on the best fit to their data which was a canal time constant (τ C) of 5.6 s, a VSM loop time constant (τ L) of 15.5 s. The Bertolini et al. model also allows different gains of the input (G i) and output (G o) of the velocity storage loop. The red model was proposed by Grabherr et al. based on vestibular thresholds across a range of frequencies. It models the canals as a simple high-pass filter with a time constant (τ) of 0.7 s and does not include a VSM. The blue model proposed by Soyka et al. uses more parameters to describe the semicircular canals, but the dominant time constant (τ 1) was 0.68 s when fit to their data and 2.16 s when fit in a historical dataset. A constant (K) was varied to provide the best fit to the current data. The time constant in the Grabherr et al. model was allowed to vary and fit to the current data (black) which had a best time constant of 1.05 s. This is effectively the same fit performed in Figure 6.

