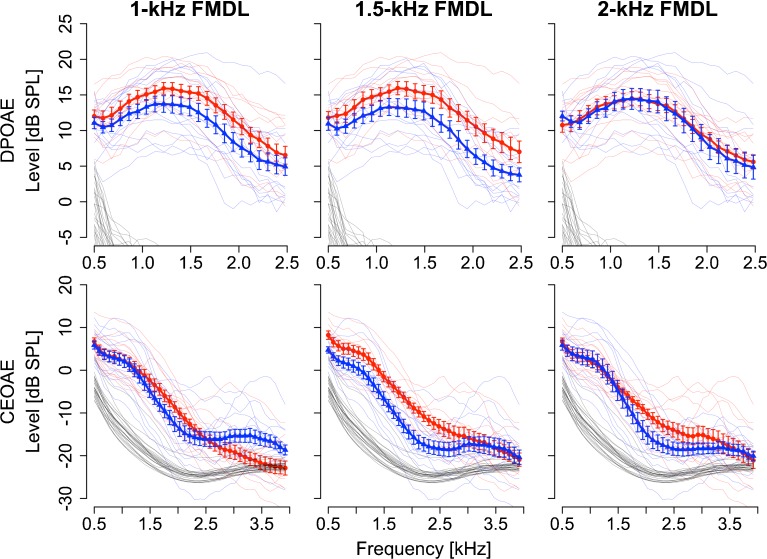
FIG. 3.
Structural differences observed between the CEOAE spectra of the higher and lower FMDL groups. DPOAE spectra (first row) and CEOAE spectra (second row) for the higher FMDL group (blue triangles) and for the lower FMDL group (red circles). Comparisons of 1-, 1.5-, and 2-kHz FMDLs are shown from left to right. Error bars show the standard errors across listeners in each group. Individual data are plotted as thin lines. Noise floors are shown as black thin lines (noise floors not shown in DPOAE spectra ranging from −30 to −20 dB SPL).

