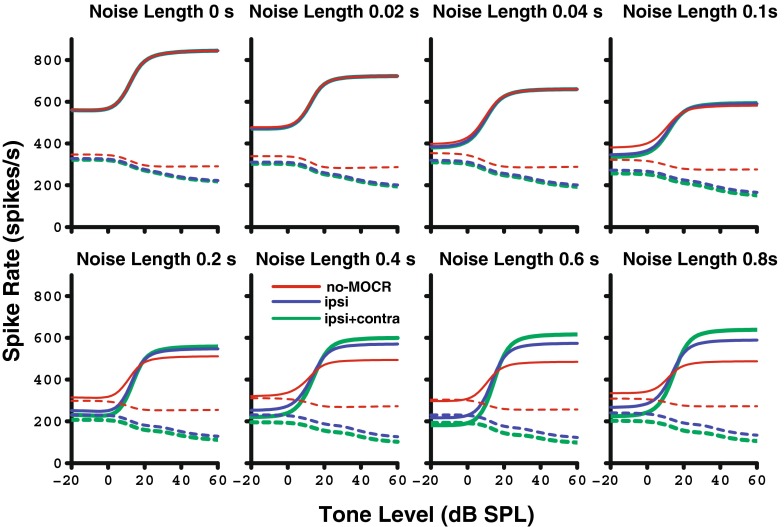
FIG. 10.
Rate-level functions as simulated with the auditory nerve model with (blue and green; best fit 15:1 binaural ratio) and without (red) efferent feedback. Each panel moving left to right shows increasing length of the 10-dB SL ipsilateral noise (with the duration preceding the tone ranging from 0 to 800 ms). Dotted lines represent the response in the noise-alone window immediately following the tone, while solid lines represent the response to tone + noise. The MOCR (blue and green) increases the separation between the firing rates of noise alone and tone + noise, which decompresses the rate-level functions and leads to improved detection and discriminability of the tone. Contralateral noise was presented at 50 dB SL for the ipsi + contra condition.

