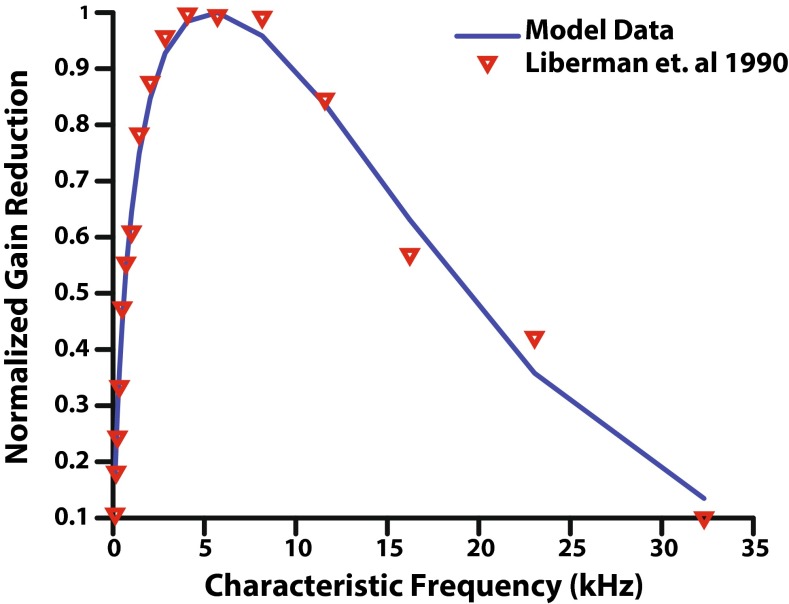
FIG. 3.
Normalized gain reduction as a function of characteristic frequency. Physiological data (Liberman et al. 1990) obtained by shocking the MOC bundle in cats is reported as red inverted triangles on a 0 to 1 scale. Synapse output from the AN model with efferent feedback was normalized to a 0 to 1 scale to match the Liberman et al. (1990) data, and was generated using the “shocks” setting of the model.

