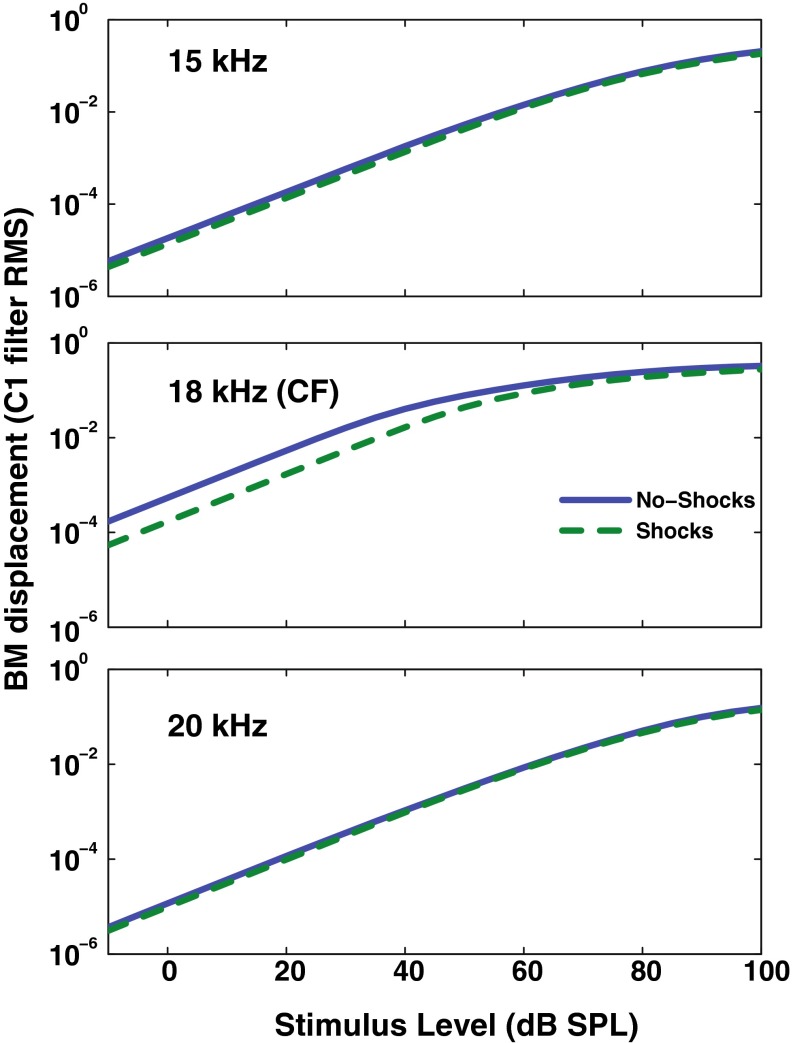
FIG. 8.
Frequency dependence relative to CF of the C1 filter output as affected by the efferent block of the AN model when simulating electrical shocks to the MOC bundle (maximum efferent effect). Growth functions for simulated BM responses are shown for tones below (top), near (middle), and above (bottom) the CF with (dashed line) and without (solid line) the “shocks” setting enabled.

