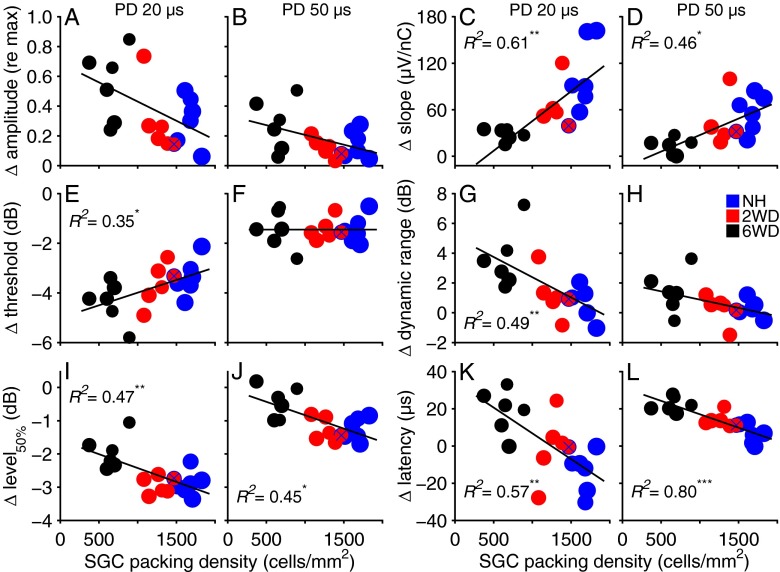
FIG. 7.
Differences in eCAP characteristics when IPG is increased from 2.1 to 30 μs plotted as function of numerical SGC packing density for 20-μs (first and third column) and 50-μs PD (second and fourth column). Symbols represent individual animals; symbol size is proportional to the average SGC perikaryal area for that animal. Both histological predictors are averages from the basal, middle, and apical turns. Solid lines are regression lines with SGC packing density as single predictor, shown here for purely visual purposes. R 2 values represent the amount of variation that can be explained by both SGC packing density and perikaryal area. The blue-crossed red symbol indicates the 2WD animal excluded from the group averages. PD phase duration, SGC spiral ganglion cell; *P < 0.05; **P < 0.01; ***P < 0.001. N = 18 for (A)–(B) and (E)–(L); N = 17 for (C) and (D).

