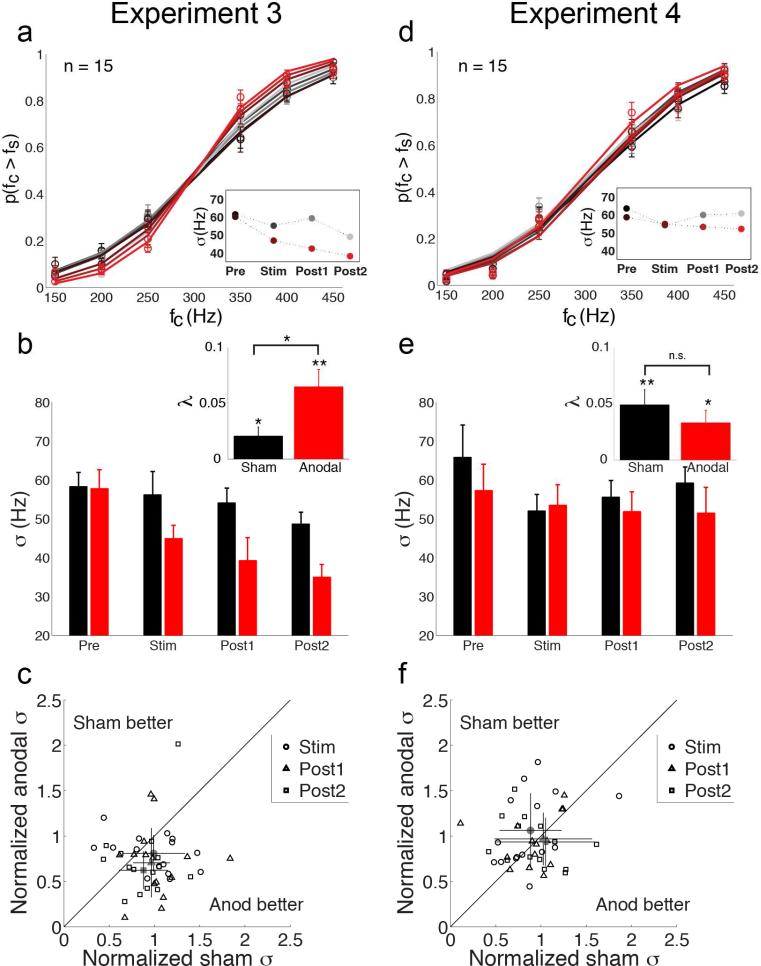
Figure 3. Results from Experiments 3 and 4.
(a) Group psychometric curves (n = 15) from frequency discrimination task (Experiment 3; tDCS over T3). Data indicate probability that the frequency of a comparison stimulus (fC) is judged to be higher than the frequency of the standard stimulus (fS = 300Hz). Error bars indicate s.e.m. Curves are fit to data aggregated over all participants. Color coding as in Fig. 1a. Inset plot shows frequency sensitivity parameter (σ) estimated from the group psychometric curves for each test block. Smaller sigma values indicate high sensitivity. (b) Average frequency sensitivity estimates calculated for individual participants during sham (black) and anodal (red) sessions. Frequency sensitivity was significantly enhanced during anodal sessions compared to sham. Inset bar plots indicate sensitivity improvement rates (λ) over the course of sham (black) and anodal (red) sessions. Error bars indicate s.e.m. Larger lambda values indicate greater sensitivity improvement rates. Improvement rates were significantly greater during anodal sessions compared to sham. *, p < 0.05; **, p < 0.01. (c) Scatter plot shows the relationship between each participant's frequency sensitivity estimates in the sham and anodal sessions during ‘Stim’ (circles), ‘Post1’ (triangles), and ‘Post2’ (squares) test blocks. Sensitivity estimates are normalized by each participant's baseline (‘Pre’) sensitivity estimate for each session. Average normalized thresholds (gray markers) reveal enhanced frequency sensitivity during anodal sessions. Error bars indicate standard deviation. (d) Group psychometric curves (n = 15) from frequency discrimination task (Experiment 4; tDCS over Oz). Conventions as in (a). (e) Average frequency sensitivity estimates calculated for individual participants in Experiment 4. Frequency sensitivity did not differ between sham and anodal sessions. Lambda values (inset plot) revealed significant improvement rates that did not differ between sessions. (f) Scatter plot shows the relationship between each participant's frequency sensitivity estimates in sham and anodal sessions in Experiment 4. Conventions as in (c). Normalized sigma estimates showed no bias toward better frequency sensitivity with anodal tDCS over Oz compared to sham.

