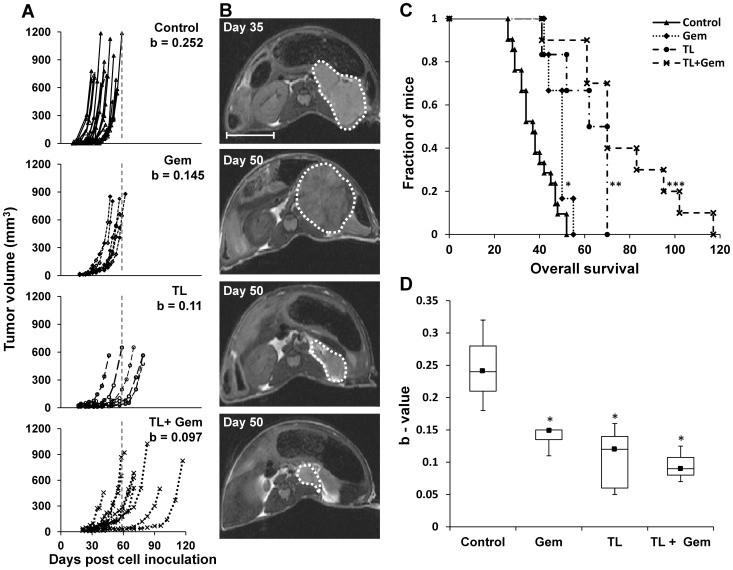
Figure 1. Treatment effect on tumor growth and mouse survival.
A. Tumor volume (mm3) for each individual mouse, as measured from T2W MRI images as a function of days post cell inoculation in control (n = 19), Gemcitabine (Gem; n = 6), TL-1181/4 (n = 9) and TL1/4+ Gem combination (n = 10) treated mice. The dashed line indicates the maximal survival day of the control-treated mice. The b-values represent the average exponential coefficients of each treatment group. The b-values of all the treated groups (Gem, TL1/4 and TL1/4+ Gem) were significantly lower compared to control (p<0.0001). B. Representative T2W anatomical axial images of Control, Gem, TL-1181/4 and TL1/4+ Gem treated tumors that were acquired on the indicated days (Bar = 1 cm) C. Kaplan-Meier survival analysis for each of the treated groups (*p<0.05; **P<0.0001; ***p<0.00001 compared to control). D. Box and Whisker plots of mean calculated b-values for each treated group (black square – median; * p<0.0001).

