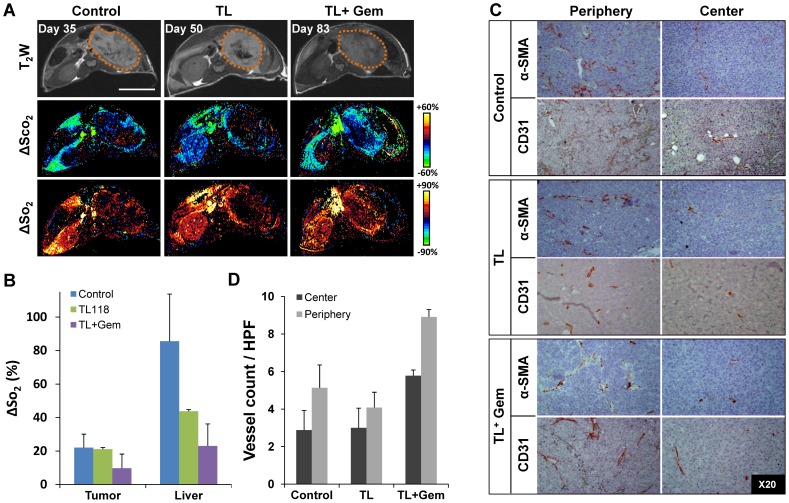
Figure 2. Effects of TL therapy combinations on NB tumor vascularization and perfusion.
A. Representative T2W fast SE images (top) and the corresponding ΔSco2 (middle row) and ΔSo2 (bottom) maps of control (left), TL-1181/4 (middle column) and TL1/4 + Gem (right) treated tumors (Bar = 1 cm). B. Mean ΔSo2 values of the tumor and liver-ROI's calculated for control (blue), TL-1181/4 (green) and TL1/4 + Gem (purple) treated mice. C. Representative histological slides immuno-stained with the smooth muscle marker α-SMA (upper-rows) and with the endothelial cell marker CD31 (lower-rows), of control (top), TL-1181/4 (middle) and TL1/4 + Gem (bottom) treated tumors. Photographs were taken from the peripheral (left column) and central (right column) regions (original magnification ×20) demonstrating the higher vascularity in tumor periphery. D. Quantification of α-SMA positive vessels/HPF was determined from the tumor center (dark) and peripheral (light) areas for each of the treatment groups. (Mean ± SE; n = 5–7 mice/group).

