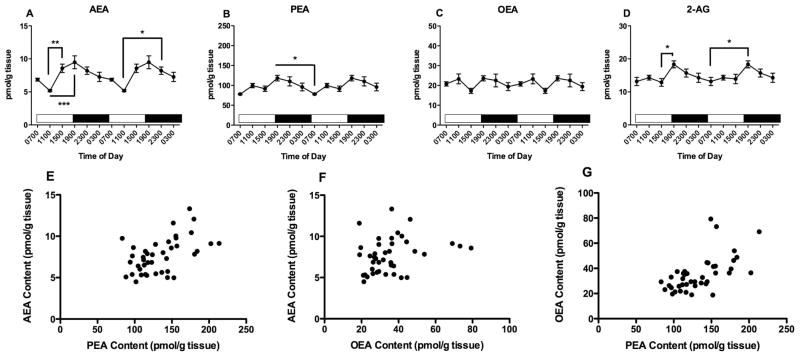
Figure 7.
Effects of time of day on striatal contents of AEA (A), PEA (B) OEA (C) and 2-AG (D) were determined using isotope dilution, LC/MS. Each point is the mean of 5–9 determinations; vertical lines represent SEM. Two cycles of the same data are displayed. For AEA, PEA and 2-AG, Bonferroni’s t-tests were used to determine differences among harvest times; significant differences are noted; * p<0.05; ** p<0.01; ***p<0.005. Correlations between AEA and PEA (E); AEA and OEA (F) and PEA and OEA (G) were examined using Pearson’s correlational analyses. The results of these analyses are reported in the text.

