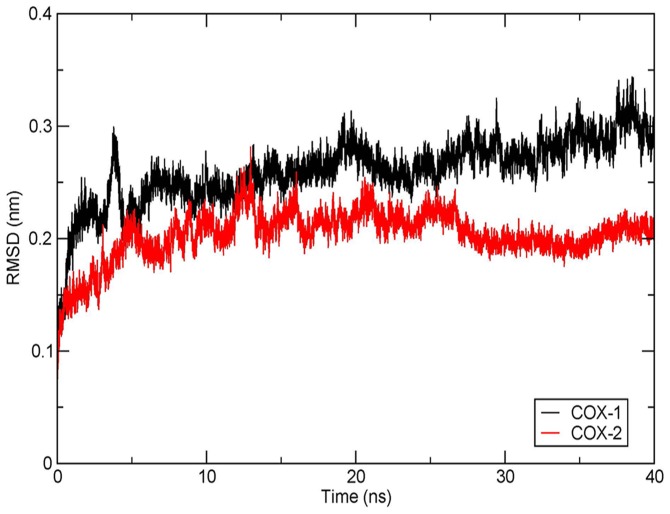
Figure 5. RMSD of amarogentin-COX complexes for 40ns time frame.
RMSD of amarogentin-COX-1 complex (black) shows an elevation in the deviation from the initial structure, reaching around 0.3nm for the final 40ns frame. The RMSD of amarogentin-COX-2 complex (red) showed initial deviations but attained stability at 15ns and remained so till the final 40ns time frame with an RMSD of 0.18nm. The plots have been generated using the GRACE plotting tool.

