
Figure 2. Principal component analysis (PCA) of the three groups.
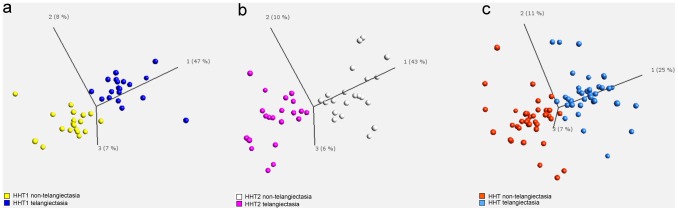
a. PCA applied to the differentially expressed long non-coding RNAs (lncRNAs)(paired t-test, q<0.15) revealed a clear separation of the telangiectasial and non-telangiectasial samples, regarding HHT1. b. PCA applied to the differentially expressed lncRNAs (paired t-test, q<0.15) revealed a clear separation of the telangiectasial and non-telangiectasial samples, regarding HHT2. c. PCA applied to the differentially expressed lncRNAs (paired t-test, q<0.15) revealed a clear separation of the telangiectasial and non-telangiectasial samples in the total group of HHT. There is no clustering into subgroups.