Figure 6.

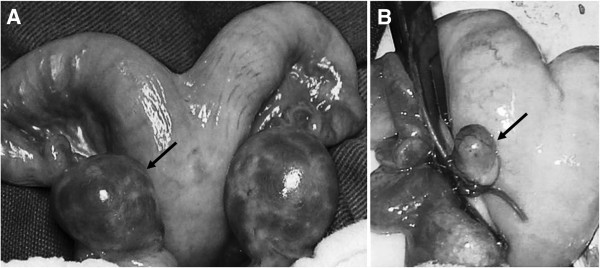
Superovulation response. A - The ovary of pure female P3, which responded to superovulation treatment with follicular development (arrow). B - The ovary of female H1, which did not respond to superovulation treatment (arrow).

Superovulation response. A - The ovary of pure female P3, which responded to superovulation treatment with follicular development (arrow). B - The ovary of female H1, which did not respond to superovulation treatment (arrow).