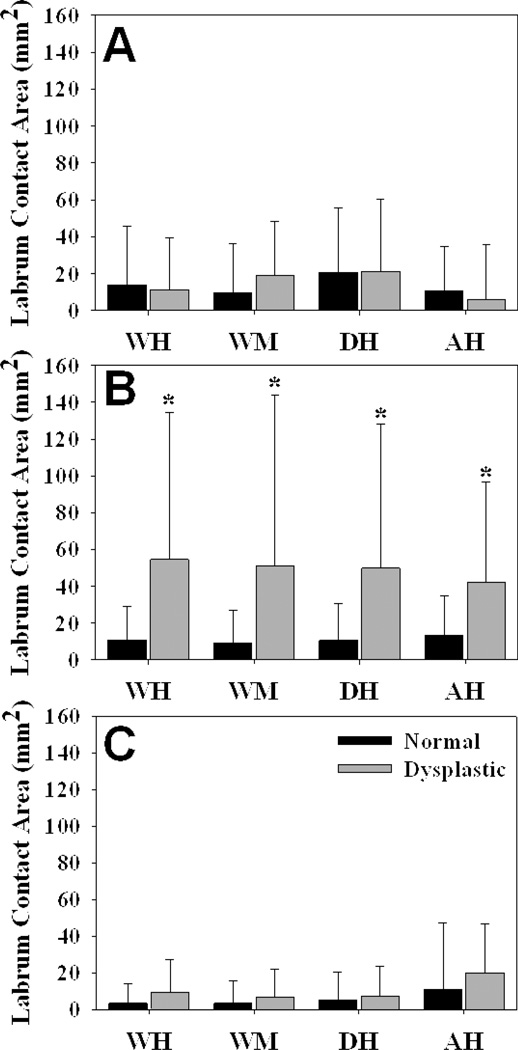
Figure 4.
Contact area on the acetabular labrum. A – anterior region. B – superior region. C – posterior region. Contact area in the superior acetabular labrum was larger in dysplastic hips than in normal hips, but there were no differences in the anterior or posterior regions during the simulated activities. Error bars indicate upper confidence bounds (at 95%). * = p < 0.05 in comparison to normal hips during the same loading scenario (n = 10 in each group).

