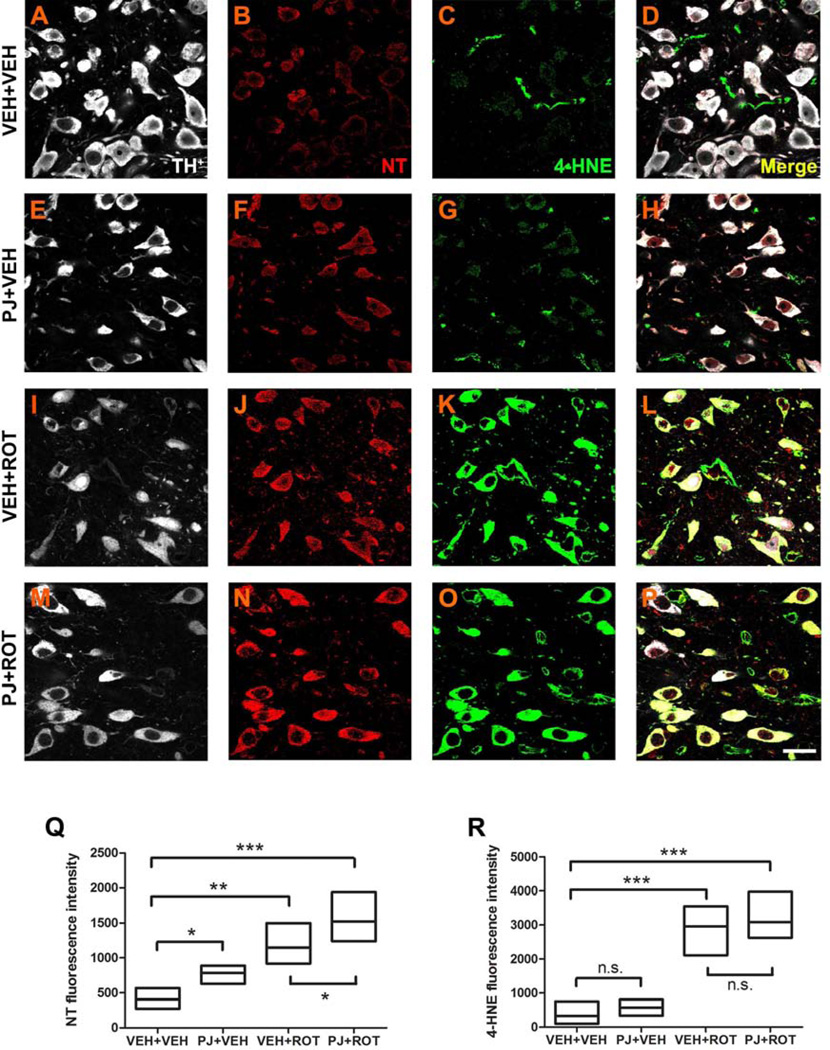
Figure 6.
Representative 100x confocal images for NT and 4-HNE immunostaining in SN sections. NT and 4-HNE were weakly expressed in controls (B and C). Increased expression of NT was noticed after oral treatment of PJ (F). Rotenone administration strongly enhanced NT immunoreactivity (J), which was further augmented when PJ was co-administered with the neurotoxin (N). A similar rotenone effect was observed for 4-HNE expression; however, PJ+ROT-treated animals did not exhibit significant differences relative to the rotenone-treated group (O vs K). White: TH+; red: NT; green: 4-HNE. Quantification of the percentage of fluorescence intensity for NT levels (Q) and 4-HNE (R) was assessed, with data representing average fluorescence immunoreactivity from 5 SN sections per animal (200–300 neurons per animal). Each treatment group was comprised of 4 rats. Scale bar = 20 µm. *** p < 0.001, ** p < 0.01, * p < 0.05 compared to VEH+VEH or VEH+ROT, Newman-Keuls post-hoc test.

