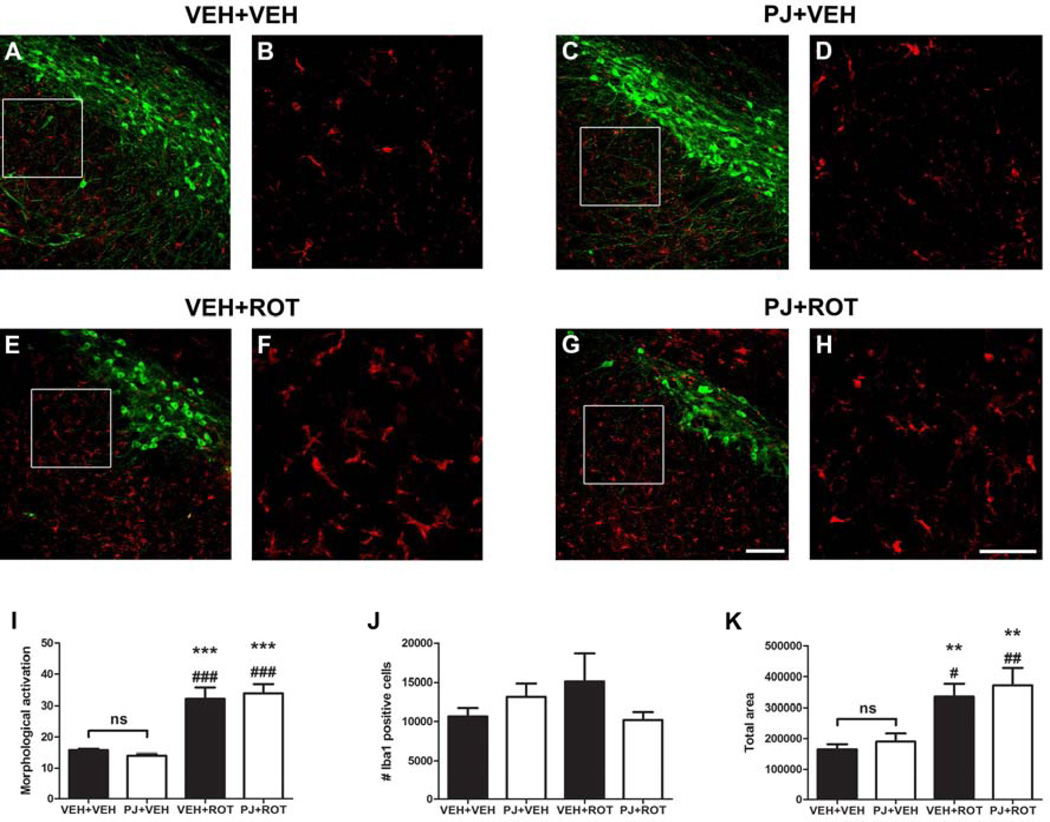
Figure 7.
Microscopy images of the immunohistochemistry for activated microglia. Immunofluorescence images of the entire SN were acquired. Untreated animals revealed a minimum expression of Iba1 (A and inset B) and oral administration of PJ did not alter Iba1 immunoreactivity (C and inset D). However, under pathological conditions, chronic rotenone treatment induced significant alterations in the morphology of nigral Iba1 positive cells (E and inset F). Iba1 expression remains unaltered after ROT+PJ treatment (G and inset H) relative to the rotenone-treated group. Quantitative analysis of Iba1 was carried out in 5 nigral sections and data is provided for “morphological activation” (I), number of Iba1 cells (J), and total area occupied by the microglial particles (K). Rotenone-induced toxicity caused a significant increase in the average size of Iba1 cells, but no changes were appreciated in the total number of cells. Oral administration of PJ did not induce microglial activation either by itself or combined with rotenone. Green: TH+; red: Iba-1. Scale bar: 50 µm. The histogram values represent the mean ± S.E.M. Significant differences between groups were determined by Newman-Keuls post-hoc test. *** p < 0.001, ** p < 0.01 vs VEH+VEH. ### p < 0.001, ## p < 0.01, # p < 0.05 vs PJ+VEH.

