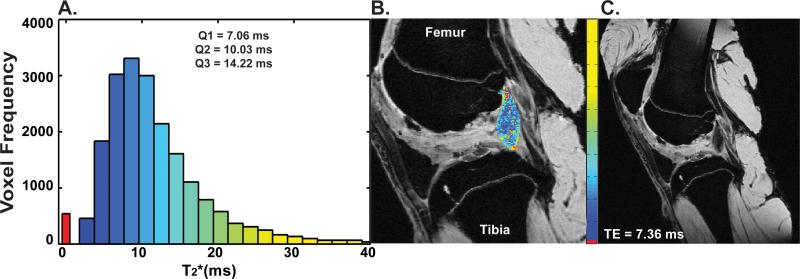
Figure 1.
Example ligament histogram showing (A) the bimodal distribution for T2* with associated T2* first quartile (Q1), median (Q2) and third quartile (Q3) summary statistics, (B) the T2* ligament map, and (C) the original DICOM image. Note the ligament voxels illustrated in a red (B) represent voxels with a T2* value of 0 ms. The MR images are a sagittal view of the femoral notch with the femur at the top of the image and the tibia at the bottom. For the MR images shown TE = 7.36 ms.

