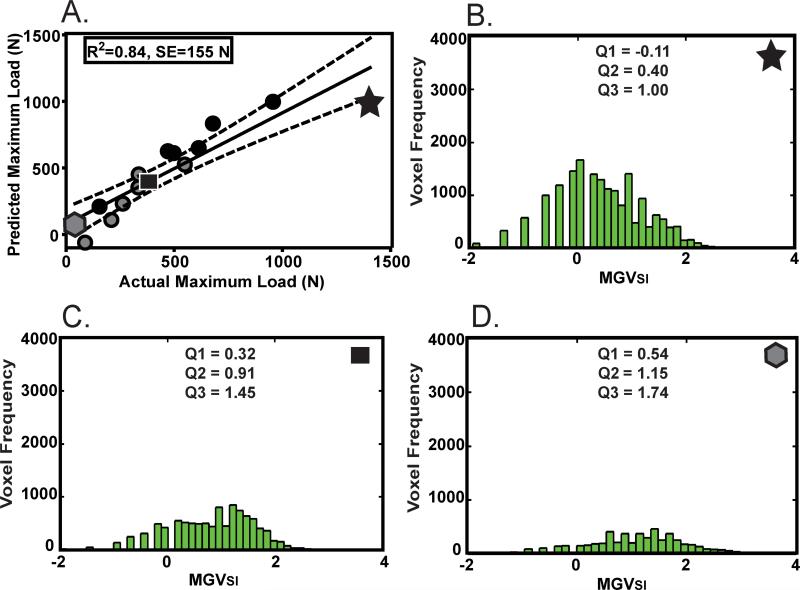
Figure 4.
Signal intensity model: (A) Actual versus predicted maximum load calculated using linear combination of VWSI and MGVSI. The dotted lines represent the 95% confidence intervals. Gray shapes represent transected ligaments while black shapes represent repaired ligaments. The highest (star, B), median (square, C) and lowest (hexagon, D) maximum load ligaments and their corresponding histogram profile are also represented with associated SI first quartile (Q1), median (MGVSI, Q2) and third quartile (Q3) summary statistics.

