
Figure 2.
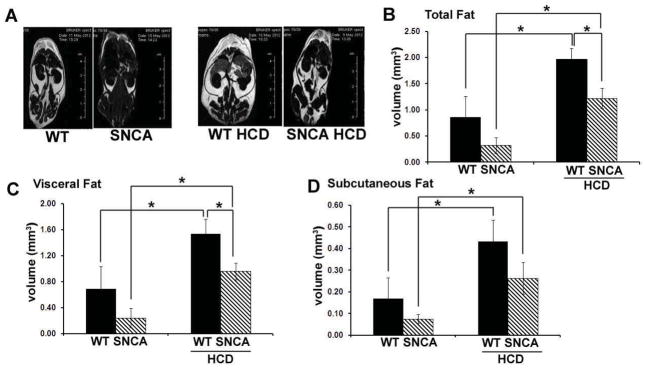
MRI analysis revealed significant differences in body fat between SNCA and wild-type mice at 28 weeks of age (after being on the diets for 16 weeks). Representative RARE images were acquired with contrast parameters that accentuated the fat signal relative to the water signal (A). These images demonstrated greater body fat in WT mice compared to SNCA for both the control and HCD groups. Quantification of total (B), visceral (C) and subcutaneous (D) fat was performed on a set of axial slices centered at the renal artery bifurcation. This analysis revealed a significantly higher total, visceral and subcutaneous fat volumes in the HCD group as compared to mice receiving a control diet, regardless of strain (p<0.008). Further, on a HCD, WT mice exhibited greater total and visceral body fat volumes than SNCA mice (p<0.007).