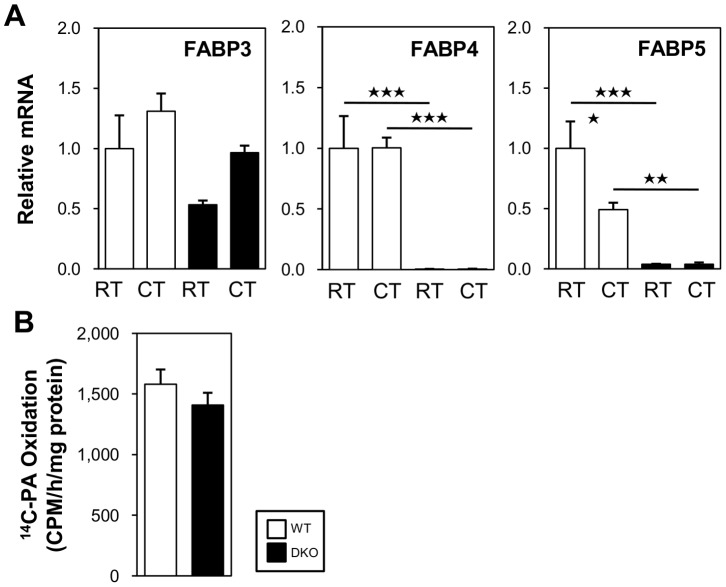
Figure 7. The expression level of FABP3 and FA oxidation capacity were comparable between WT and DKO mice.
(A) The mice were maintained at room temperature or in a cold room (4°C) for 4 h in the fed state. The total RNA from BAT was extracted for quantitative real-time PCR. n = 4–5/group. (B) The FA oxidation by BAT homogenates was estimated in vitro. The mice were placed in a cold room (4°C) for 2 h and then sacrificed. n = 4–5/group. *p<0.05; **p<0.01; ***p<0.001.

