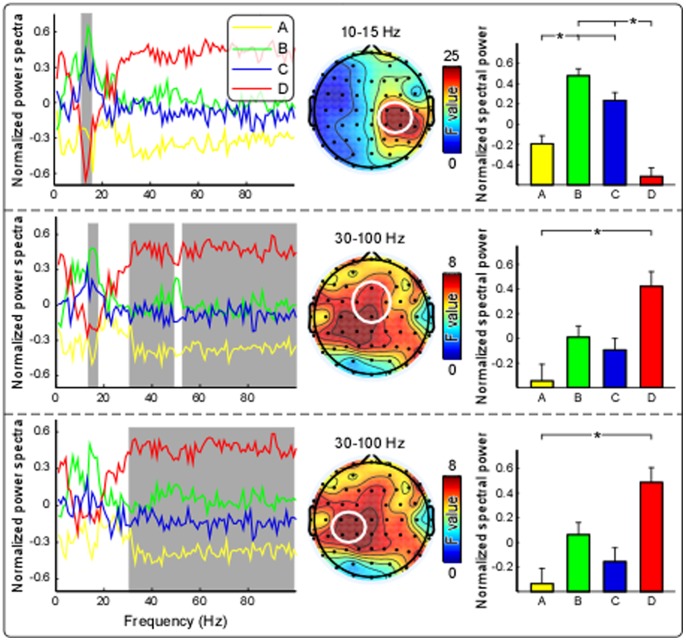
Figure 2. Comparison of normalized power spectra among four stimulation conditions.
Normalized power spectra, measured at contralateral-central electrodes (C2, C4, CP2, and CP4; top), frontal-central electrodes (Fz, FC1, FC2, and Cz; middle), and ipsilateral-central electrodes (C1, C3, CP1, and CP3; bottom), were respectively displayed in yellow, green, blue, and red for conditions A, B, C, and D. As marked in grey, significant differences of power spectra across stimulation conditions were dominantly observed at contralateral-central electrodes from 10 to 15 Hz (top), at frontal-central electrodes from 30 to 55 Hz and from 60 to 100 Hz (middle), and at ipsilateral-central electrodes from 30 to 100 Hz (bottom). The summarized spectral power, measured at contralateral-central electrodes (top) within alpha band (10–15 Hz, top), at frontal-central (middle) and ipsilateral-central (bottom) electrodes within gamma band (30–100 Hz), were respectively marked in yellow, green, blue, and red, and were compared among four stimulation conditions. Error bars represent, for each condition, ± SEM across subjects. Asterisk * indicates a significant difference (P<0.05, Tukey’s post hoc tests).

