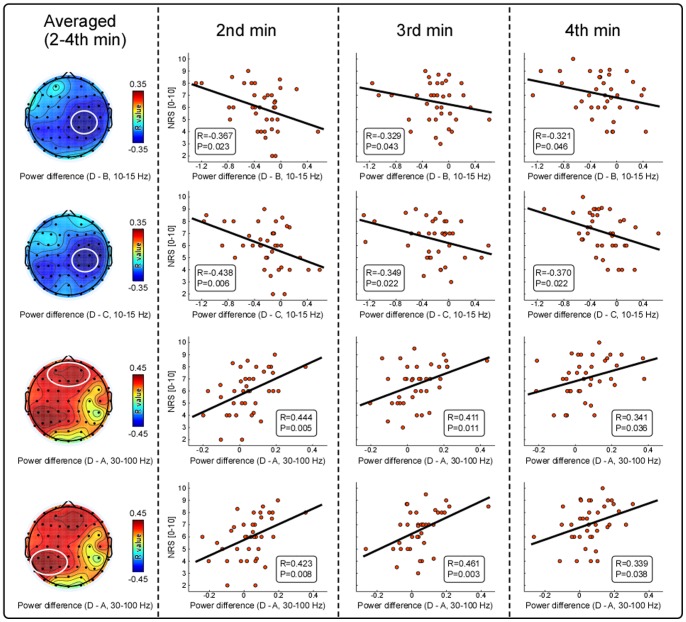
Figure 3. Relationships between spectral power differences and subjective intensity of pain perception.
Negative correlations between spectral power differences (left panel, D–B, D–C) within alpha frequency band (10–15 Hz) and averaged subjective pain intensity during the interval of 2nd to 4th min were maximal at contralateral-central electrodes (C2, C4, CP2, and CP4). Positive correlations between spectral power difference (left panel, D–A) within gamma frequency band (30–100 Hz) and averaged subjective pain intensity during the interval of 2nd and 4th min were maximal at prefrontal-central (left: AF3, AF4, F1, Fz, and F2) and ipsilateral-posterior (right: CP1, CP3, CP5, P1, P3, and P5) electrodes. Specifically, the subjective pain intensity at each min were negatively correlated with alpha spectral power difference (D–B, D–C) at contralateral central electrodes (marked in the white circles), and positively correlated with gamma spectral power difference (D–A) at prefrontal-central and ipsilateral-posterior electrodes (marked in white circles). Each dot represents values from each subject, and black lines represent the best linear fit.

