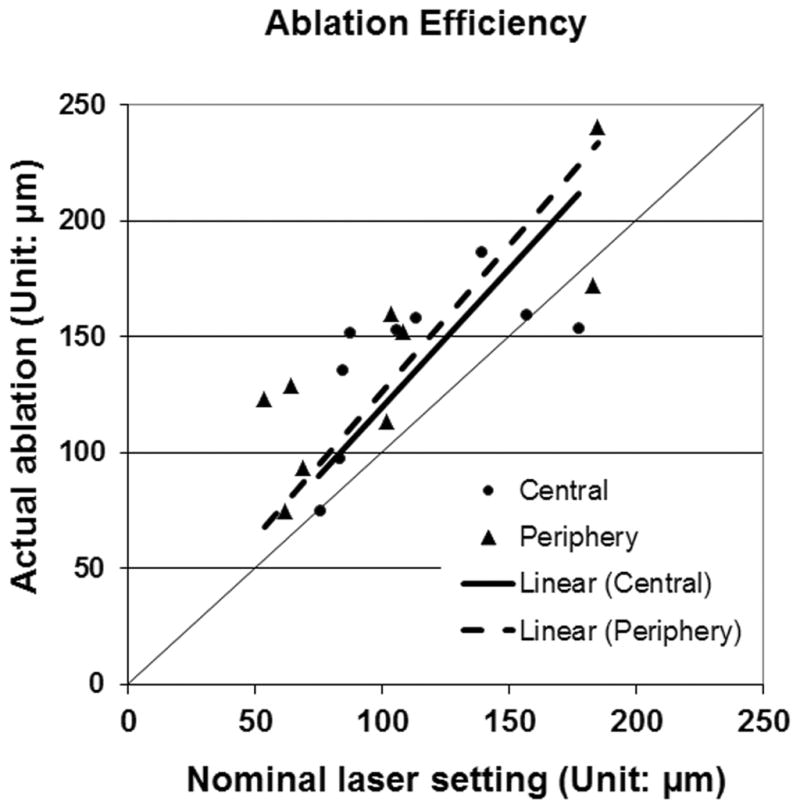
Figure 1.

Linear regression plots to evaluate the excimer laser ablation in the center and at the periphery. The thick solid line is the regression line for central ablation (y=1.1957x). The dashed line is the regression line for periphery ablation (y=1.2628x). The thin solid line is y=x. In cases where subjects had 2 PTK surgeries, data from the first surgery only is included in this graph.
