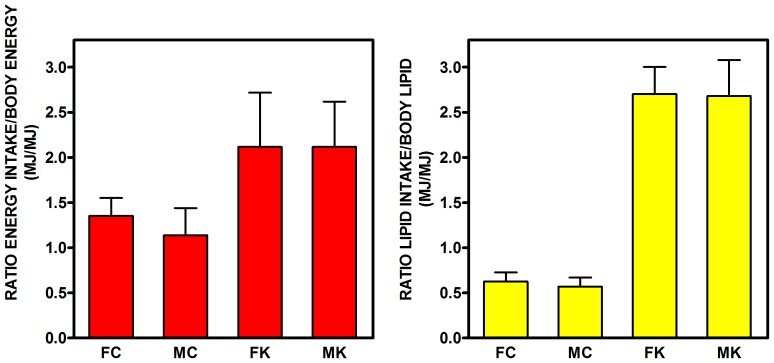
Figure 3. Ratios of energy and lipid intake with respect to whole body energy and lipid content in rats fed a control or simplified cafeteria diet for 28 days.
FC = female control; MC = male control; FK = female cafeteria; MK = male cafeteria. Each point corresponds to the mean ± sem of six different animals (data for food/lipid intake, N = 3 (2-rat cages), data for body energy and lipid N = 6). Statistical significance of the differences (2-way-ANOVA): Energy: P<0.001 for diet, NS (i.e. P>0.05) for sex; Lipid: P<0.0001 for diet, NS for sex.

