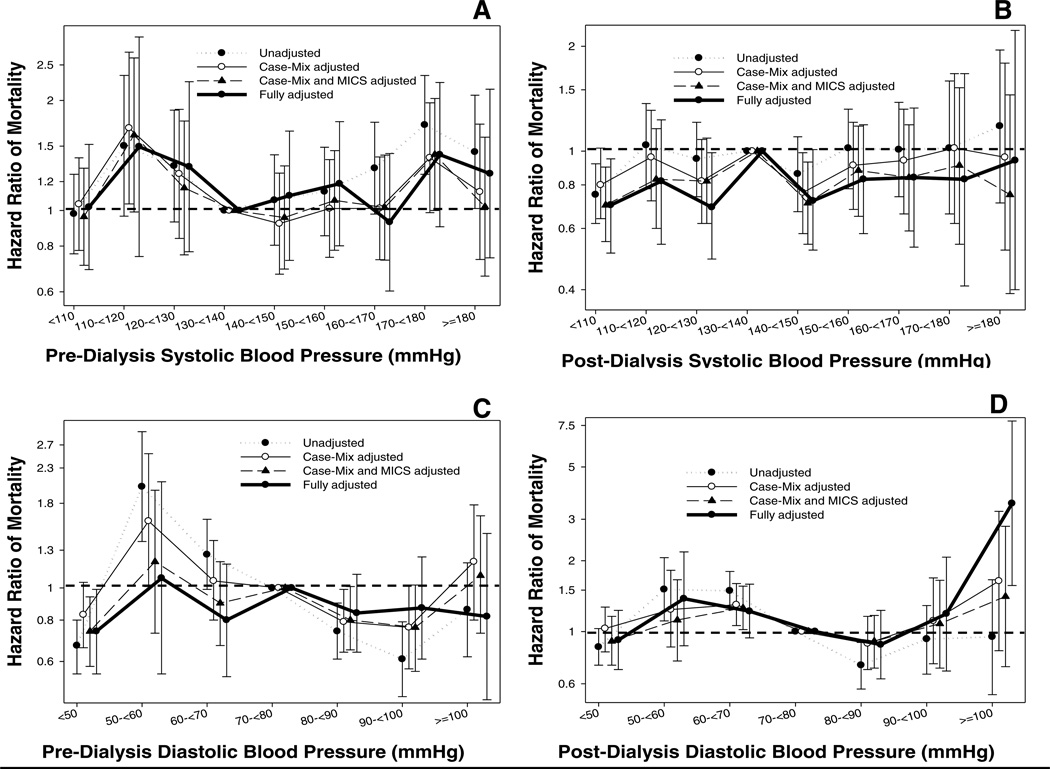
Figure 1.
Hazard ratio (95% confidence intervals) of post-transplant mortality (Panel A: pre-dialysis systolic BP; Panel B: post-dialysis systolic BP, Panel C: pre-dialysis diastolic BP, Panel D: post-dialysis diastolic BP) across different categories of blood pressure level using Cox regression analyses in 13,881 long-term dialysis patients who underwent renal transplantation and who were observed over a 6-year study period (7/2001–6/2007).
Case-mix models adjusted for age, gender, recipient race-ethnicity, diabetes mellitus, dialysis vintage, primary insurance, marital status, dialysis dose as indicated by Kt/V (single pool), presence or absence of a hemodialysis catheter, and residual renal function during the entry quarter and 8 co-morbidities; Malnutrition-inflammation-complex syndrome (MICS) models adjusted for all of the above covariates plus body mass index, nPCR, serum or blood concentrations of TIBC, ferritin, calcium, phosphorous, bicarbonate, peripheral white blood cell count, lymphocyte percentage and albumin; Case-mix, MICS and transplant models adjusted for all of the above plus donor type, donor age, donor gender, panel reactive antibody (PRA) titer (last value prior to transplant), number of HLA mismatches, cold ischemia time, DGF (except when DGF was a dependent variable in logistic regression models), and extended donor criteria.

