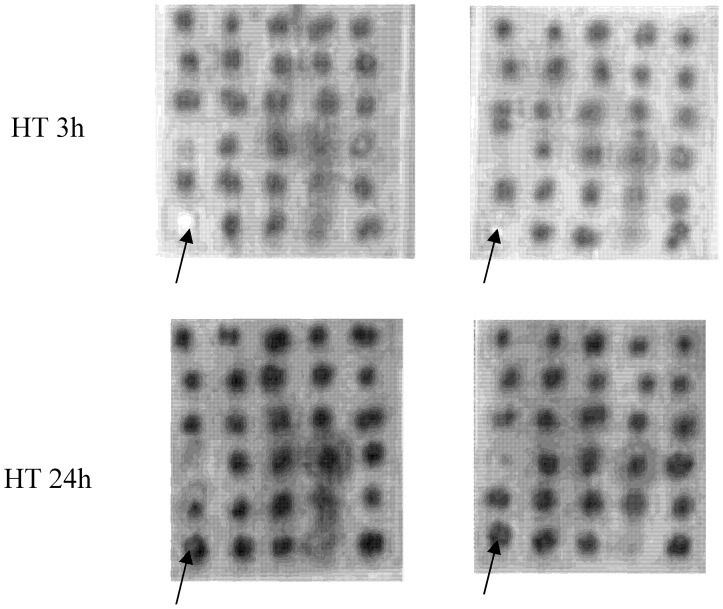
Figure 10. Mini-array analysis of the serine phosphorylation status of 30 sperm proteins after a HT of 3 h or 24 h.
The mini-array analysis and the distribution of the proteins analysed are described in Figure 1. The figure shows a representative image of two replicates coming from two different sperm samples and is representative of twelve separate experiments. Arrows (→) mark HSP70.

