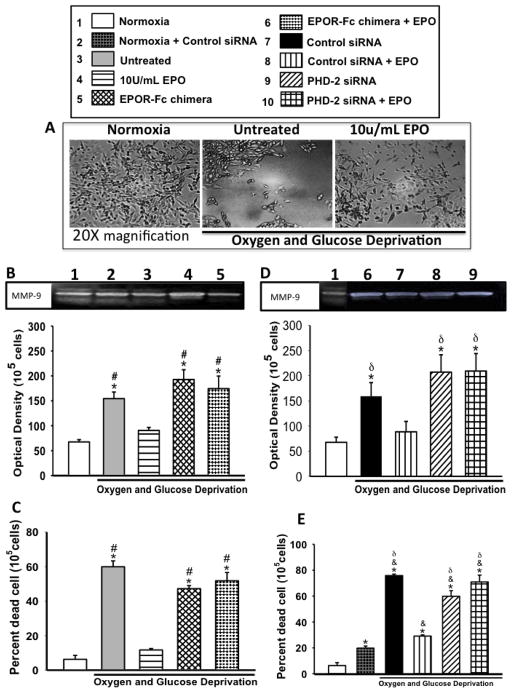
Figure 4. The effects of EPO treatment on MMP-9 activity and subsequent cell death after OGD.
(A) Shows representative image of NGF-differentiated cells with and without EPO and OGD. (B &D) Densiometric quantification of MMP-9 activity, (B) in the presence of EPOR chimera, (D) in the presence of PHD-2 siRNA. (C &E) Shows percent cell death as assess by trypan blue exclusion (C) in the presence of EPOR chimera, (E) in the presence of PHD-2 siRNA. Data represent the mean and (± SD) n=6 in all groups. *P<0.01 compared to 10U/ml EPO treated group. #P<0.01 compared to untreated. &P<0.05 compared to Normoxia+Control siRNA. δP<0.01 compared to untreated. MMP-9 P= 0.001, Cell death, P ≤ 0.001, using Kruskal-Wallis ANOVA on Ranks. Inhibition of PHD-2 significantly increased MMP-9 activity and cell death with and without EPO.

