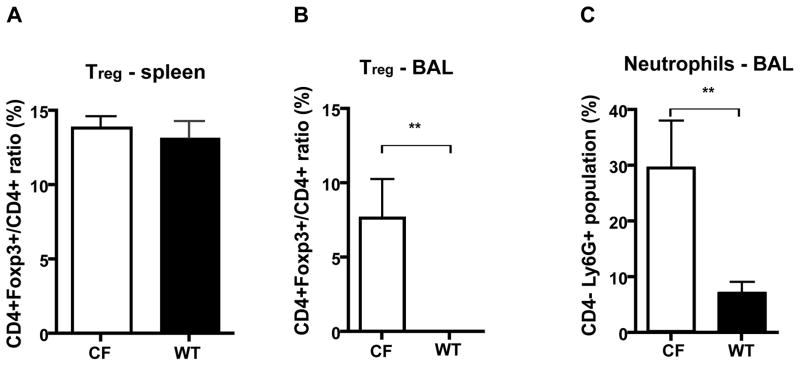
Figure 1.
Comparison of Treg and neutrophil frequencies in CF and WT mice. (A) Splenocytes and (B, C) BAL fluid cells harvested from CF mice and WT mice were analyzed by FACS. The ratio of CD4+Foxp3+/ CD4+ reflects the frequency of Treg as the percentage of the CD4 positive population. Data are presented as the average of 3 mice. Error bar denotes SEM. **P < 0.01, T test. CF: cystic fibrosis, WT: wild type.

