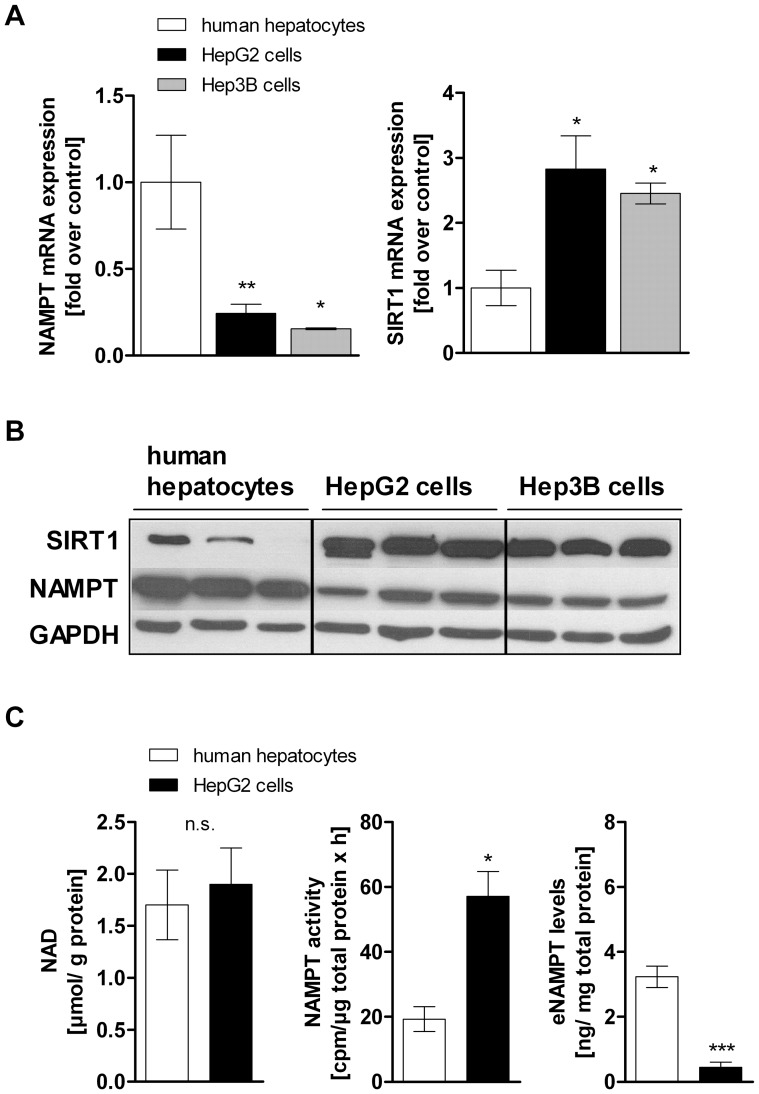
Figure 1. NAMPT and SIRT1 expression in hepatocarcinoma cells and primary human hepatocytes.
A) mRNA expression and B) protein expression of NAMPT and SIRT1 in primary human hepatocytes (n = 7), HepG2 cells (n = 8) and Hep3B cells (n = 3). Representative Western Blot is shown out of three independent experiments. Measurement of C) intracellular NAD levels (left panel, primary hepatocytes n = 4, HepG2 cells n = 6), basal NAMPT enzymatic activity (middle panel, primary hepatocytes n = 3, HepG2 cells n = 4) and extracellular NAMPT (eNAMPT) levels (right panel, primary hepatocytes n = 3, HepG2 cells n = 6) in primary human hepatocytes and HepG2 cells. Data are shown as mean± SEM. Difference between two groups was evaluated using unpaired Student’s t-test (*p<0.05, **p<0.01, ***p<0.001).

