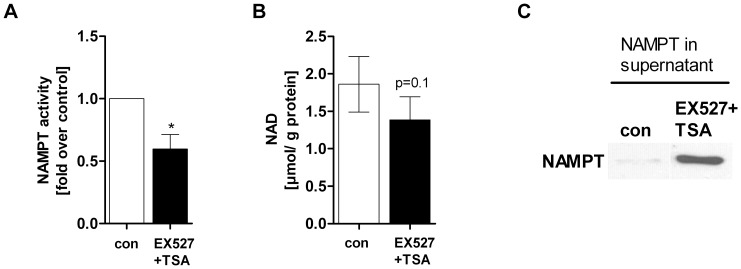
Figure 8. SIRT1 inhibition downregulates NAMPT activity and induces NAMPT release in HepG2 cells.
HepG2 cells were treated with EX527+TSA [20 µM EX527+1 µM TSA] or serum-free medium (con) for 24 h. Measurement of A) NAMPT enzymatic activity (n = 3). Counts (cpm) were normalised to µg total protein in each sample (*p<0.05). B) NAD level were determined by HPLC (n = 5) and normalised to total protein amount in each sample. C) Supernatant of EX527 treated HepG2 cells was used for determination of eNAMPT level. One representative Western blot out of 3 independent experiments is shown.

