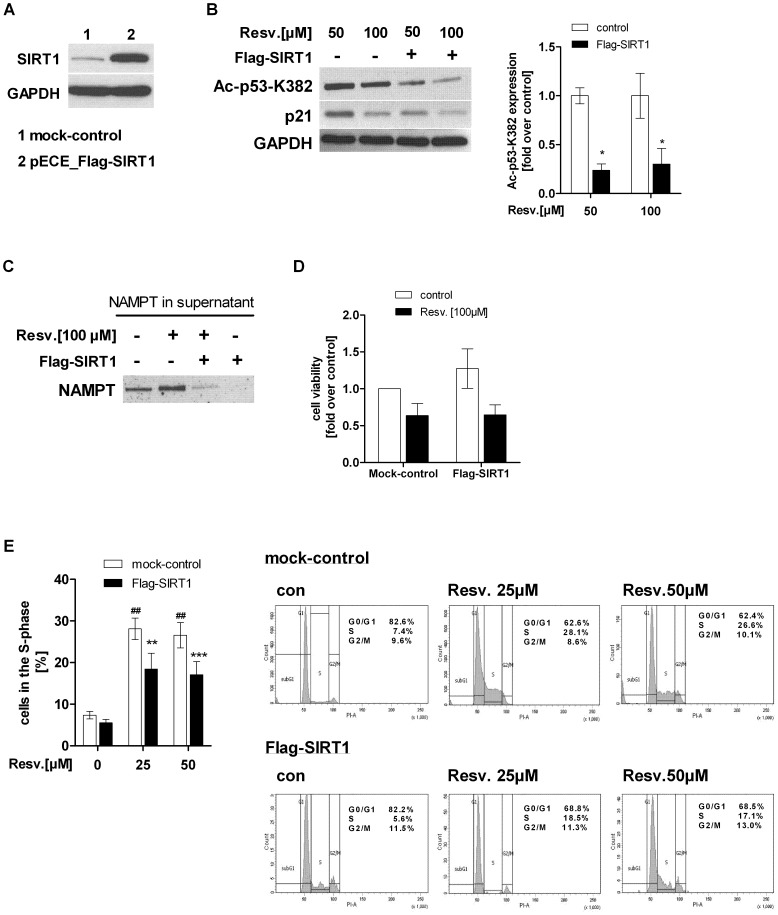
Figure 9. SIRT1 overexpression in HepG2 cells reversed resveratrol-induced SIRT1 inhibition, NAMPT release and S-phase arrest.
A) SIRT1 was transiently overexpressed in HepG2 cells [2.0 µg plasmid/0.5x106 cells] using the expression vector pECE_Flag-SIRT1 from addgene (plasmid 1791; [35]). Lysates of cells transfected with the empty vector pECE (mock-control) (1) or pECE Flag-SIRT1 vector (2) were used for Western Blot analysis. B) mock-transfected (mock-control) and Flag-SIRT1 transfected HepG2 cells were stimulated with resveratrol [50, 100 µM Resv.] for 24 h and Western Blot analysis of acetylated p53 (K382), p21 and GAPDH was performed. Densitometric anaylsis of acetylated p53 of three independent Western Blots is shown. Data were normalised to non-transfected HepG2 cells stimulated with resveratrol alone which was set 1. C) To analyse the effect of SIRT1 overexpression on resveratrol-induced NAMPT release, supernatant of mock-transfected and Flag-SIRT1 transfected HepG2 cells stimulated with or without resveratrol [100 µM] were used to measure eNAMPT level. One representative Western blot out of 3 independent experiments is shown. D) Cell viability of mock-transfected and Flag-SIRT1 transfected HepG2 cells treated with resveratrol [100 µM] (black bars) was measured using WST-1 assay (n = 3). Data were normalised to untreated mock-control which was set 1. E) mock-transfected (white bars) and Flag-SIRT1 transfected HepG2 cells (black bars) were stimulated with resveratrol [25, 50 µM] for 24 h. Percentage of cells in the S-phase were measured by PI staining and FACS analysis. All data are shown as mean± SEM (n = 4). The difference between two groups was evaluated using unpaired Student’s t-test (##p<0.01 mock-transfected cells compared to mock-transfected cells treated with resveratrol (white bars, mock-control), **p<0.01, ***p<0.001 Flag-SIRT1 transfected cells treated with resveratrol (black bars) compared to resveratrol-treated mock-transfected cells (white bars).

