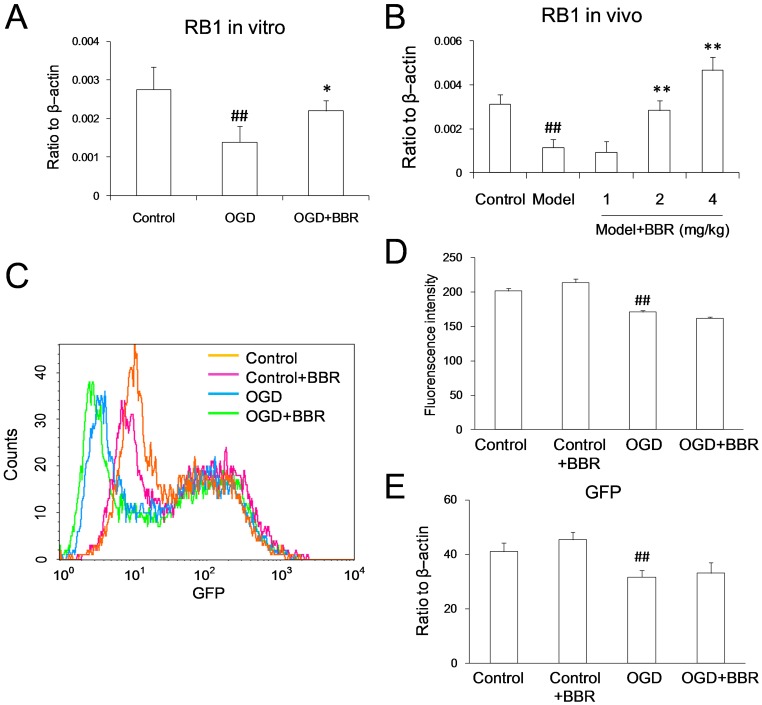
Figure 6. Berberine (BBR) up-regulated the RB1 mRNA, but couldn’t influence the activity of RB1 promoter.
(A) RB1 mRNA level in primary neurons as measured using real-time PCR. BBR (0.5 µg/ml) was added in the culture 1 h before OGD treatment and throughout the reperfusion time. Data represent the mean ± S.D. of three independent experiments (n = 3). # P<0.05, ## P<0.01 v.s. the normal; *P<0.05, **P<0.01 v.s. the OGD. (B) RB1 mRNA level in the hippocampus of cerebral ischemia mice as measured using real-time PCR. BBR was administrated by intraperitoneal injection with three different dosages (1, 2, 4 mg/kg). Data represent the mean ± S.D. of six mice (n = 6). # P<0.05, ## P<0.01 v.s. the control; *P<0.05, **P<0.01 v.s. the model. (C)–(E) RB1 promoter. (C) Overlay of the fluorescence intensity of GFP with RB1 promoter. (D) Quantity of the fluorescence intensity of GFP. (E) GFP mRNA level started by RB1 promoter detected using real-time PCR. Data are presented as mean ± S.D. of three independent experiments (n = 3). ## P<0.01 v.s. the control.

