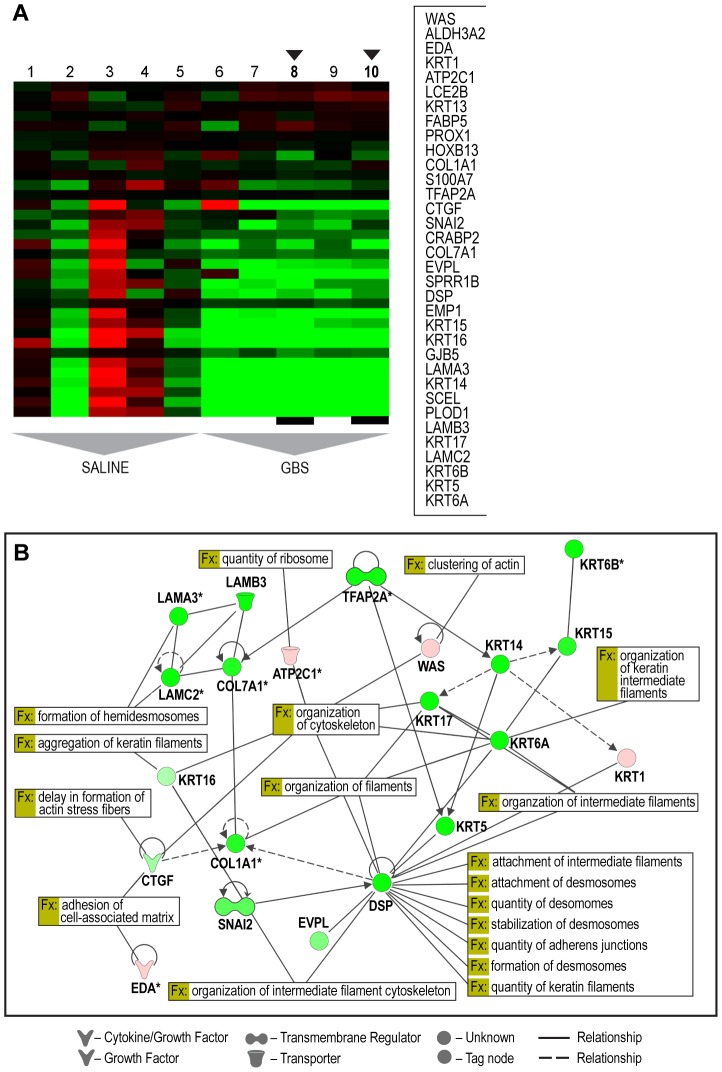
Figure 1. Selected heatmap and paired Ingenuity Pathway Analysis diagrams demonstrating downregulation across cytostructural components including multiple cytokeratins, laminins, and collagens (panel A: C4 Module 153; panel B: IPA diagram).
Genes shown were filtered for interactions reported in humans only. Direct and indirect interactions are shown by solid lines and dashed lines respectively. Green indicates gene downregulation and red depicts upregulation. Color intensity represents the average of log2 fold change with brighter colors representing a more significant difference between GBS and controls. Symbols for each molecule are presented according to molecular functions and type of interactions. Functional assignations attributed by IPA software. An asterisk indicates that there were multiple probesets for the same gene on the Affymetrix array. The black arrows indicate the GBS cases with chorioamnionitis.

