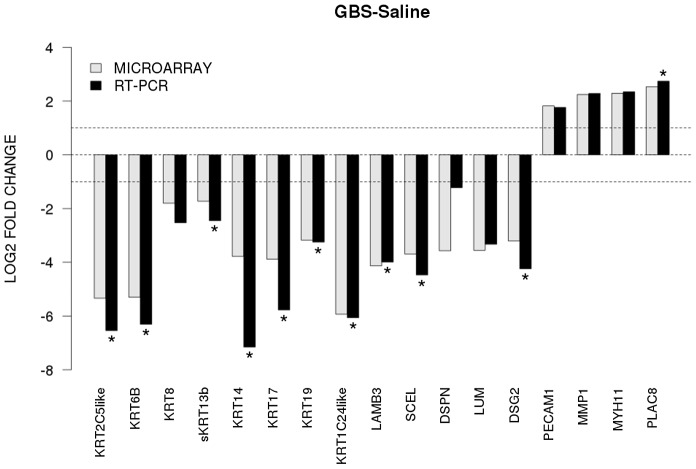
Figure 2. The x-axis represents individual genes and the y-axis fold-change in expression by microarray (gray bars) or qRT-PCR (black bars).
Genes that were significantly up- or downregulated by qRT-PCR between GBS and controls are indicated by an asterisk (two-sided t-test, p<0.05). All genes shown were also significant in the unadjusted microarray analysis.

