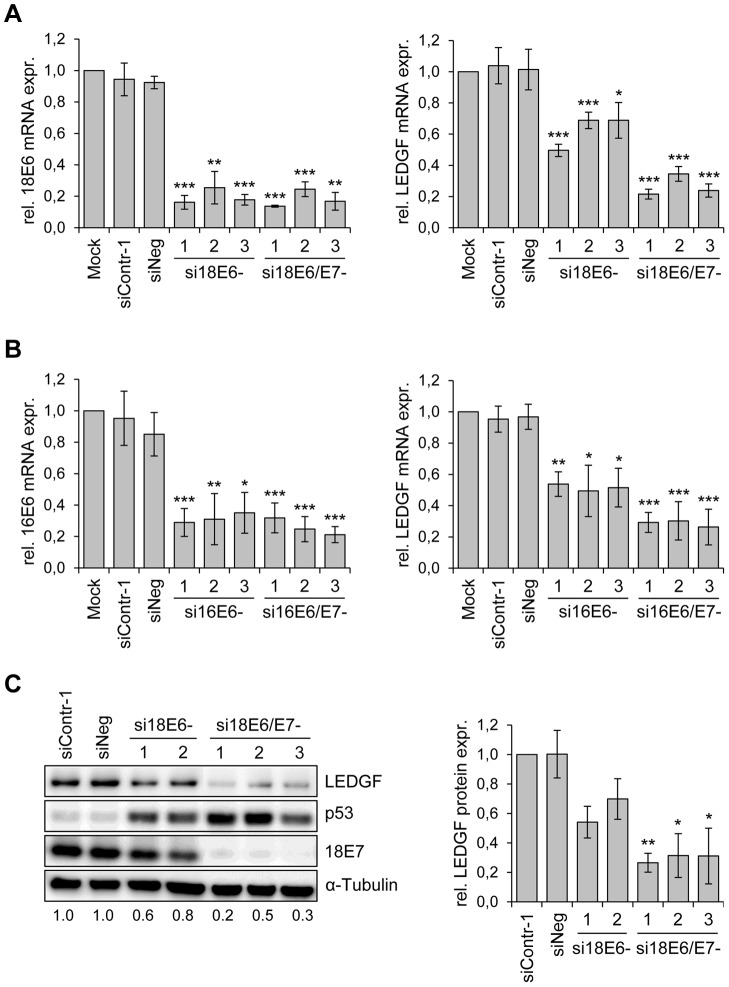
Figure 1. HPV oncogene silencing represses LEDGF expression.
(A) siRNA-mediated silencing of HPV18 E6 and E6/E7 expression (left panel) and LEDGF transcript levels (right panel) in HPV18-positive HeLa cells. si18E6-1, -2, and -3: three different siRNAs specifically blocking HPV18 E6 expression; si18E6/E7-1, -2, and -3: three different siRNAs concomitantly blocking HPV18 E6 and E7 expression. Mock: cells treated with transfection reagent only; siContr-1 and siNeg: control siRNAs. Indicated are relative mRNA levels determined by qRT-PCR, the value for mock-transfected cells was arbitrarily set at 1.0. Standard deviations are indicated. Asterisks above columns indicate statistically significant differences from mock-treated controls, with p-values of ≤0.05 (*),≤0.01 (**), or ≤0.001 (***). (B) siRNA-mediated silencing of HPV16 E6 and E6/E7 expression (left panel) and LEDGF transcript levels (right panel) in HPV16-positive SiHa cells. si16E6-1, -2, and -3: three different siRNAs specifically blocking HPV16 E6 expression; si16E6/E7-1, -2, and -3: three different siRNAs concomitantly blocking HPV16 E6 and E7 expression. Asterisks above columns indicate statistically significant differences from mock-treated controls, with p-values of ≤0.05 (*),≤0.01 (**), or ≤0.001 (***). (C) Determination of LEDGF protein amounts. Left panel: Representative immunoblot analysis of HeLa cells. Shown are LEDGF, p53 and HPV18 E7 protein levels upon silencing of endogenous HPV18 E6 (si18E6-1, and -2) or HPV18 E6/E7 (si18E6/E7-1, -2, and -3) expression. α-Tubulin: loading control. Relative quantifications of LEDGF signal intensities are indicated below each lane, the value for siContr-1 transfected cells was set at 1.0. Right panel: Quantification of LEDGF protein levels in HeLa cells, densitometrically determined from three independent immunoblot analyses. Standard deviations are indicated. Asterisks above columns indicate statistically significant differences from siContr-1-transfected cells, with p-values of ≤0.05 (*) or ≤0.01 (**).

