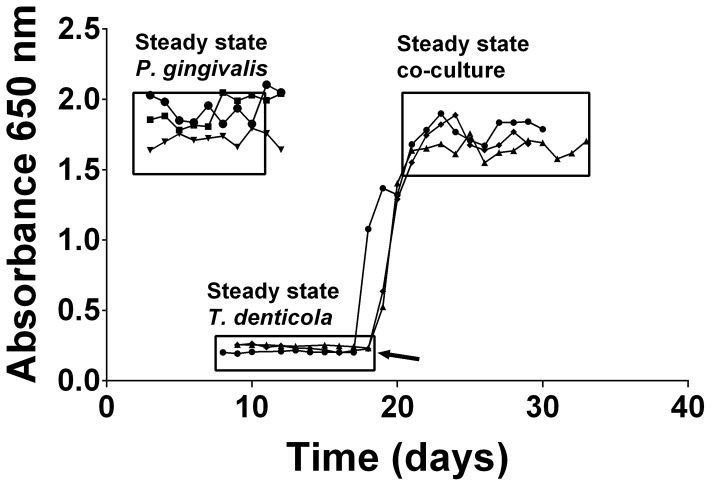
Figure 1. Continuous culture of P. gingivalis and T. denticola mono- and co-cultures.
Cell density of P. gingivalis and T. denticola mono- and co-cultures from three independent continuous cultures in OBGM with the dilution rate of 0.044 h−1 and mean generation time of 15.8 h as determined by measuring A650 nm. The arrow shows the addition of P. gingivalis to a steady state T. denticola culture.

