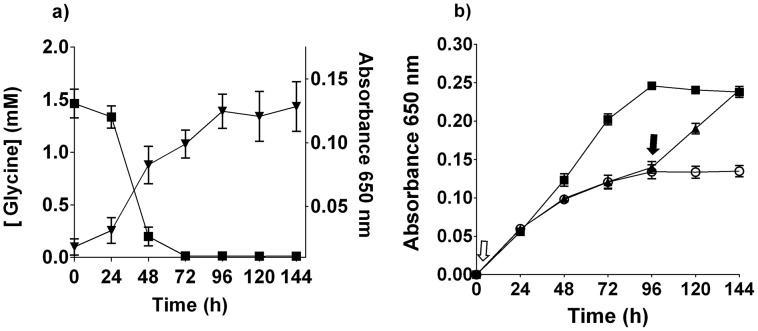
Figure 3. T. denticola growth and glycine.
(a) The concentration of free glycine in T. denticola culture (black square; left axis). T. denticola growth curve in the same medium (black inverted triangle; right axis). Data points are the mean and standard deviation of three biological replicates. (b) Glycine (10 mM) was added to OBGM either before inoculation with T. denticola (black square, open arrow) or at 96 h after inoculation (black triangle, filled arrow) and bacterial growth was determined by A650 nm measurement. T. denticola culture with no added glycine (white circle). Results are expressed as mean ± standard deviation obtained from eight replicates.

