
Figure 6. Free glycine production during P. gingivalis growth.
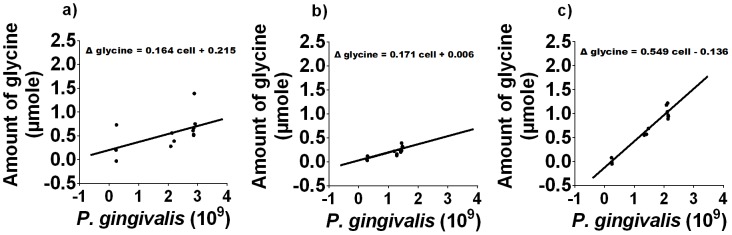
The difference in the amount of free glycine relative to that at t = 0 h as a function of P. gingivalis cell numbers in a) OBGM/PBS, b) OBGM and c) OBGM/T. denticola conditioned medium. A regression line was fitted using a linear mixed modelling approach. The slope represents the amount of glycine produced/109 P. gingivalis cells.