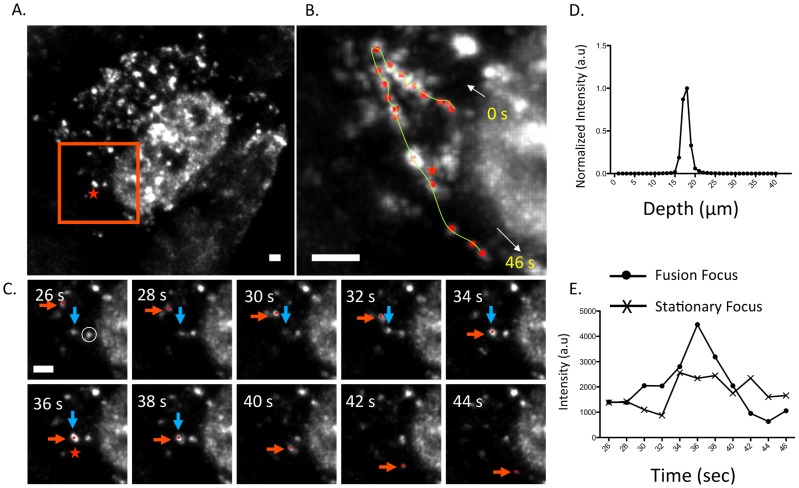
Figure 6. Fusion event of an WSN PA-GFP focus in the cytoplasm of MDCK cells.
Maximum intensity projection from inverted selective-plane illumination microscopy (iSPIM) movie of MDCK cells infected with WSN PA-GFP (MOI = 5) at 16 hpi, 36 seconds (s) after onset of tracking (A). The red-boxed region is highlighted in (B and C), and the red star indicates the region where colocalization of two GFP foci (marked in red and blue arrows) occurred. A single WSN PA-GFP focus trajectory; each red dot is a spot tracked in time, the yellow line is the overall trace, and white arrows indicate the direction of the PA-GFP movement (B). The total track duration is 46 s. Part C contains still frames of the red-boxed region in part A from 26–44 s, and illustrates colocalization and subsequent fusion of two foci. The red arrow indicates the PA-GFP focus that is being tracked and the blue arrow indicates the PA-GFP focus with which it fuses. All scale bars are 2 µm. An intensity versus depth plot of the colocalized foci, indicated by the red star in part A, demonstrates a single peak indicating that the fusion occurs in a single diffraction-limited spot (D). An intensity vs. time plot of the fused focus compared to an adjacent stationary focus, identified by the white circle in part C, during the same time frame (E). The asterisk marks the time corresponding to the colocalization event.

