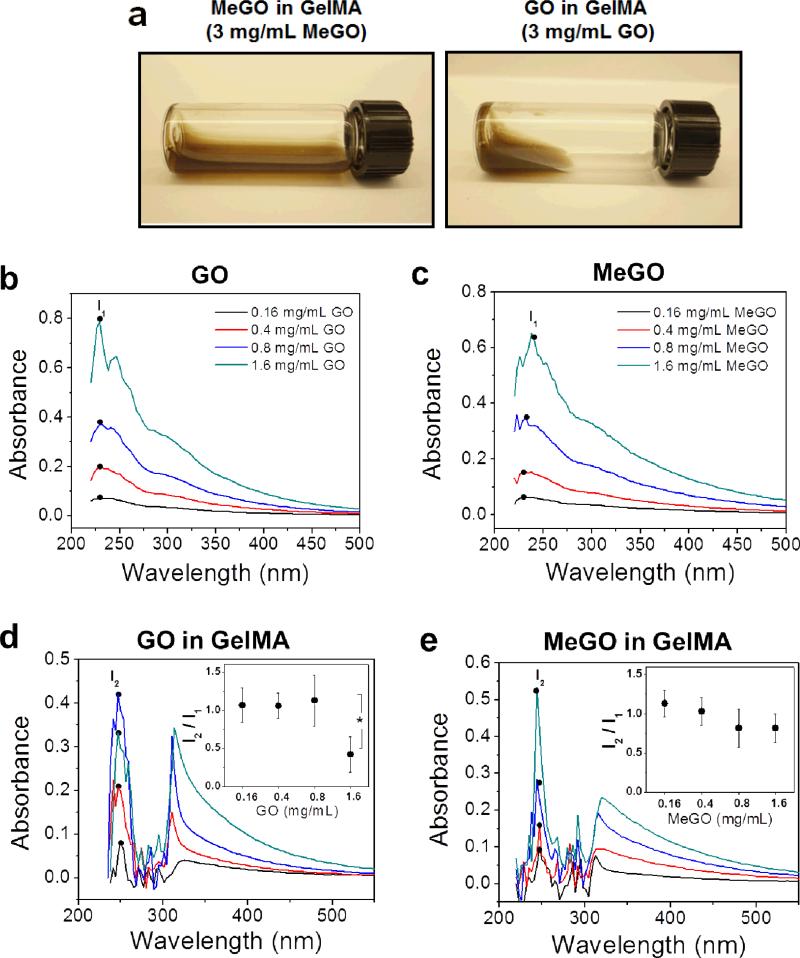
Figure 2.
(a) Photographs of 3 mg mL−1 of MeGO (left) or GO (right) dispersed in GelMA solution. UV-vis absorption spectra of (b) GO, (c) MeGO, (d) GO in GelMA, and (e) MeGO in GelMA. The concentration of GO or MeGO was varied from 0.16 to 1.6 mg mL−1. The legends in (b) and (c) are the same for (d) and (e), respectively. Inset graphs in (d) and (e) represent the ratio of characteristic peaks of GO-GelMA or MeGO-GelMA at 254 nm (I2) to that of GO or MeGO at 231 nm (I1).(*p<0.05)

