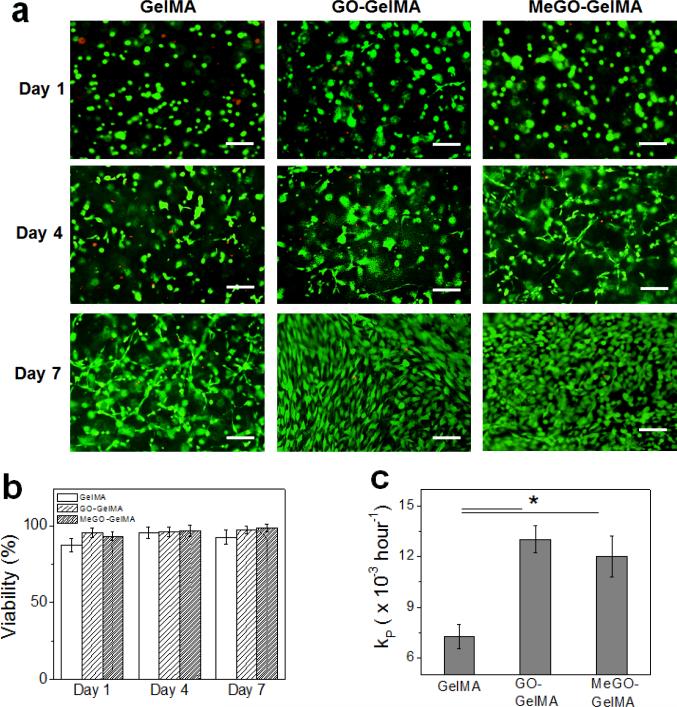
Figure 7.
(a) Fluorescent images of fibroblasts encapsulated in GelMA, GO-GelMA and MeGO-GelMA hydrogels over time. The cells were stained with calcein-AM and ethidium homodimer-1 to visualize live (green) and dead (red) cells.(Scale bar: 100 μm) (b) Viability of the encapsulated cells at various time points. (c) Proliferation rate (kP) determined from Equation 2.(*p<0.05)

