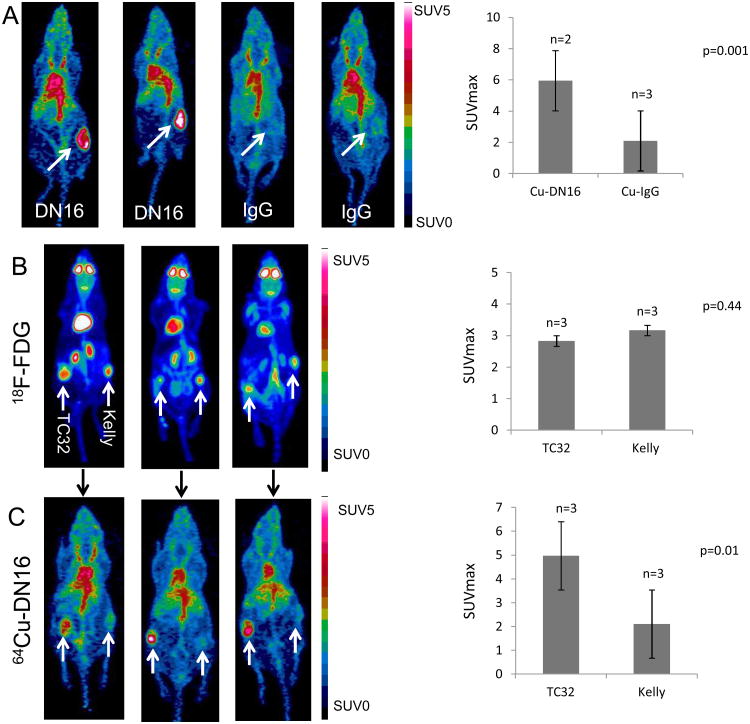
Figure 2. PET imaging with a 64Cu-labeled anti-CD99 antibody compared to 18F-FDG.
A. Mice with A673 (CD99+) xenografts (white arrows) were injected with either 64Cu-DN16 or 64Cu-IgG and PET imaged 24 h post-injection. Quantitated data plotted as mean +/- SEM for n=5 animals. B. Mice with TC32 (CD99+) xenografts on the left and Kelly (CD99-) xenografts on the right were PET imaged one hour after injection of 18F-FDG PET. Data plotted as mean +/- SEM for n=3 animals. C. The same mice were injected with 64Cu-DN16 and PET imaged 24 h after injection. Data plotted as mean +/- SEM for n=3 animals. Significance determined by the Student's t-test.

