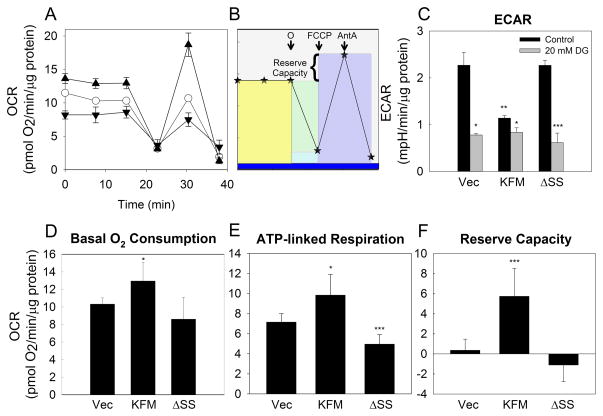
Figure 2. KISS1 enhances mitochondria respiratory capabilities.
Measurement of mitochondrial function in C8161.9Vector, C8161.9KFM, and C8161.9ΔSS cells using the XF24 bioanalyzer. A, Measurement of oxygen consumption rate (OCR) under the basal conditions followed by the sequential addition of oligomycin (O), FCCP and antimycin A as depicted schematically in Panel B. Symbols = ○ (open circle), Vector; ▲ (closed up triangle), KFM; ▼ (closed down triangle), KFMΔSS. Colored blocks in Panel B represent basal oxygen consumption (yellow); ATP-linked respiration (green); maximal oxygen consumption (purple), proton leak (light blue) and other respiration (dark blue). Reserve capacity is the difference between maximal ATP-linked respiration and maximal oxygen consumption. C, Extracellular acidification rate (ECAR) measured contemporaneously with OCR measurements in the absence (black bars) or presence (gray bars) of 2-deoxyglucose (2-DG; 20 mM). D, Basal oxygen consumption; E, ATP-linked respiration; and F, reserve capacity derived from OCR measurements in Panel A. N=6–8; Error bars = SEM; *, P<0.05; **, P<0.01; ***, P<0.001.

