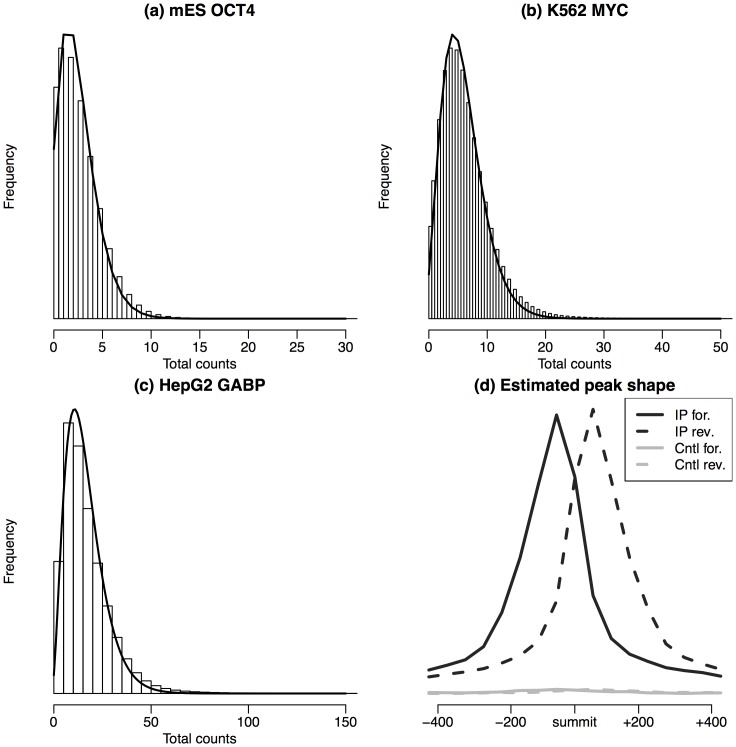
Figure 2. (a)–(c): histogram of total read counts in background regions from different datasets: (a) TF OCT4 in mouse ES cells; (b) TF MYC in K562 cell line; and (c) TF GABP in HepG2 cell line.
The black solid curve is the theoretical density for the negative binomial distribution with parameters estimated from the method of moment procedure. It can be seen that the total counts in background regions can be approximated well by a negative binomial distribution, and the method of moments for estimating negative binomial parameters works well. (d) Estimated peak shape from polyaPeak for K562 MYC data.

