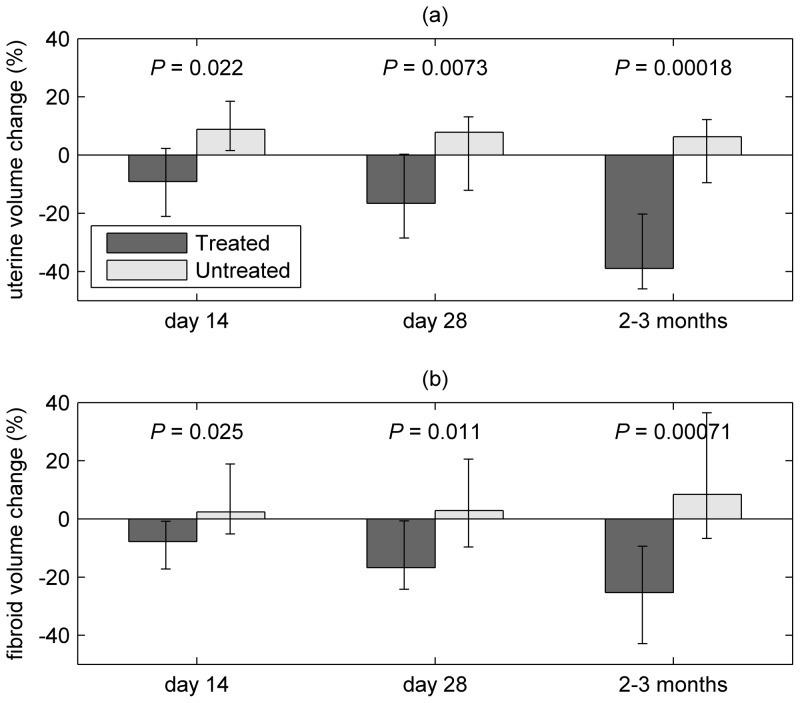
Figure 4. Median % volume change of (a) uterus and (b) largest fibroid from baseline at day 14, day 28 and 2 to 3 months (i.e. within 10 days of hysterectomy), measured by T2-weighted MRI; error bars show the interquartile range.
Figure shows data for treated (groups 1 and 2) and untreated participants.

