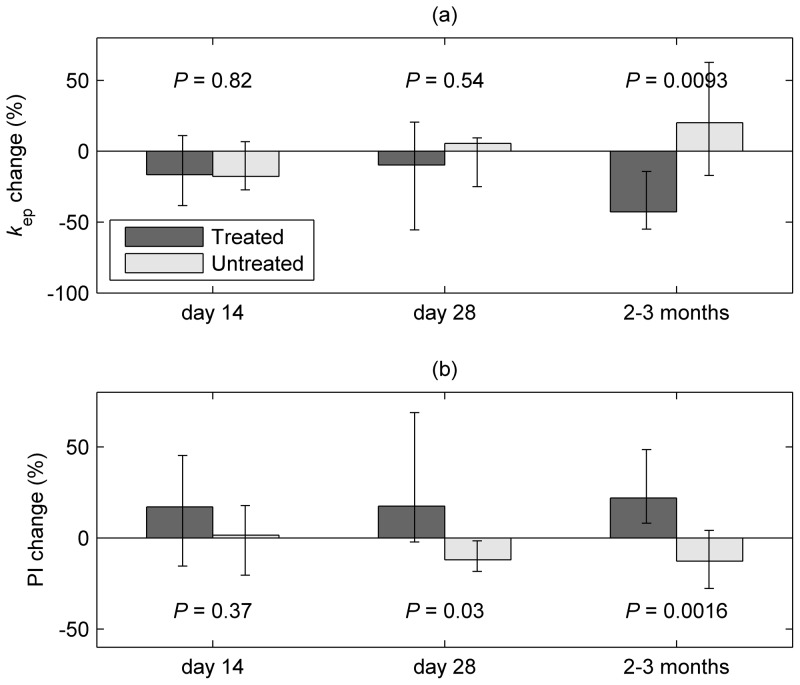
Figure 5. Changes in uterine vascular properties at day 14, day 28 and 2 to 3 months (i.e. within 10 days of hysterectomy).
(a) Shows median % change in the fibroid dynamic contrast-enhanced MRI (DCE-MRI) parameter k ep from baseline, while (b) shows corresponding changes in pulsatility index (PI) as measured by Doppler ultrasound of the uterine arteries. Error bars show the interquartile range. Figure shows data for treated (groups 1 and 2) and untreated participants.

