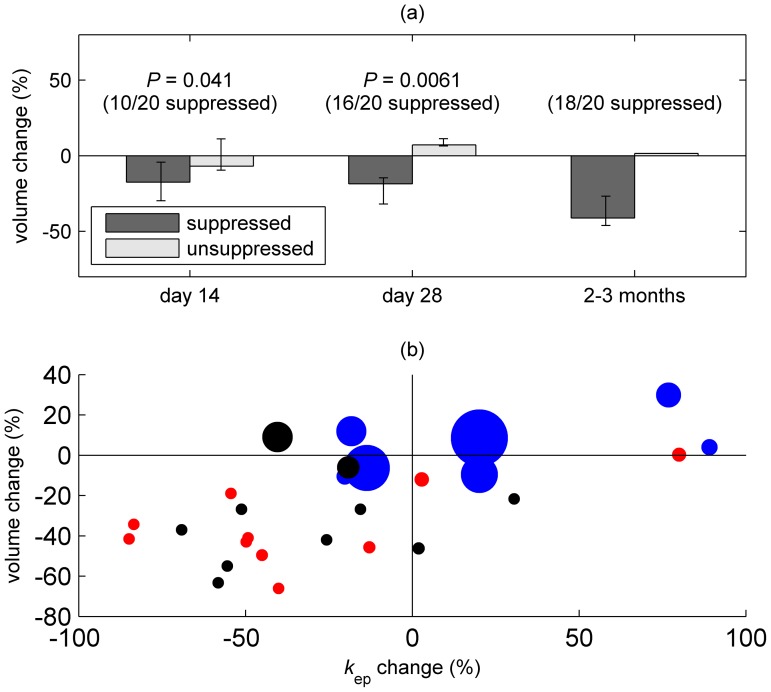
Figure 6. Relationship between oestradiol concentration, and volumetric and vascular changes.
(a) shows median uterine volume change, assessed by T2-weighted MRI; error bars show the interquartile range. Data are shown for treated participants (groups 1 and 2), classified as oestradiol-suppressed and -unsuppressed as described in the text. (b) shows changes in uterine volume and fibroid k ep (DCE-MRI) for all patients (group 1: black, group 2: red, group 3: blue) at the final MRI scan. The areas of the data points are proportional to blood oestradiol concentration at the same time point (the largest data point corresponds to a value of 1153 pg/mL).

